
Bob Dickinson
-
Posts
242 -
Joined
-
Last visited
-
Days Won
16
Content Type
Profiles
Forums
Enhancement Requests
Everything posted by Bob Dickinson
-
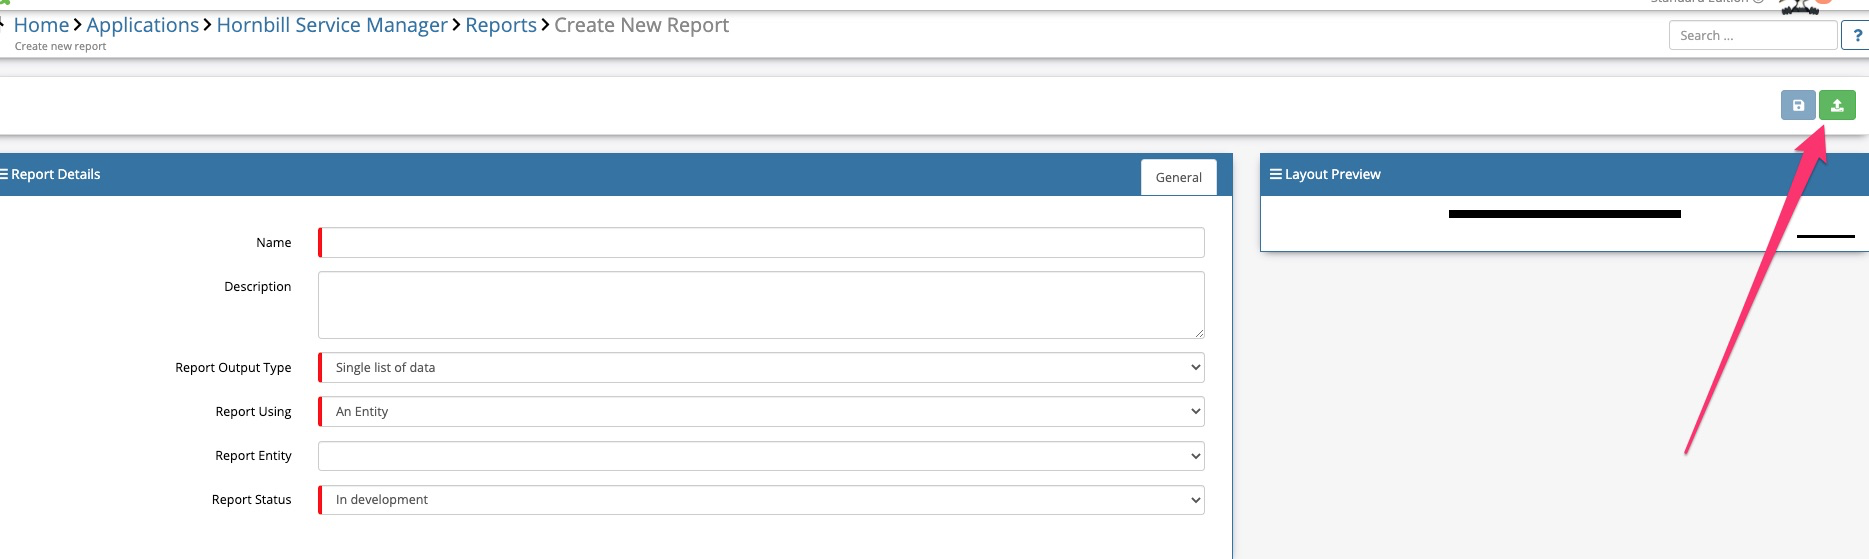
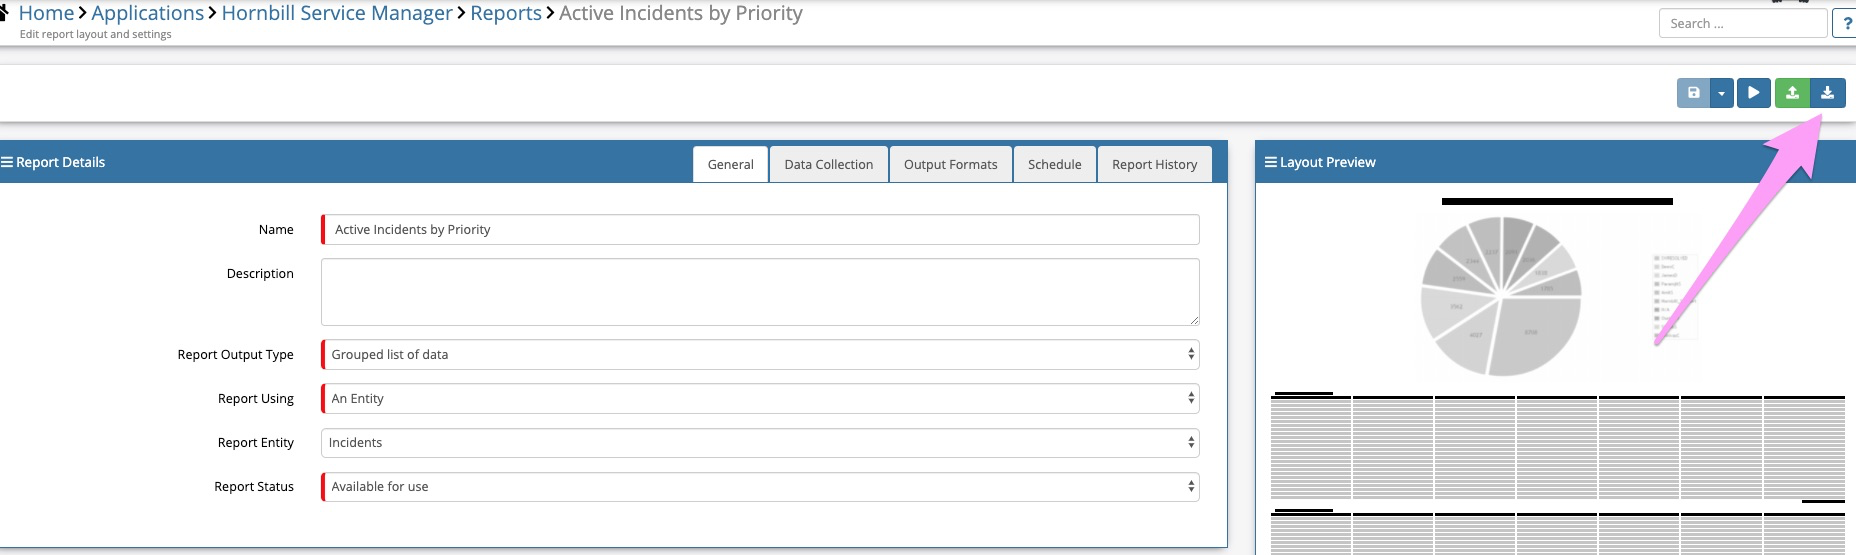
 Hi @Victoria Heeley I've attached a couple of example reports which should help you on your way here - they both have a chart at the top of the generated PDF which shows the top 10 categories used last month for Incidents. I could remember if you used the Logging Categories or Closure Categories, so I have created a report to cover each of them. To upload them on your instance, simply create a new report and press the green upload button in the top right hand corner Kind Regards Bob top-10-incident-logging-profiles-last-month.report.txt top-10-incident-closure-profiles-last-month.report.txt
-
Hi @Josh Bridgens Having had a look at this, I don't think we can get out exactly what you want. We do not store/record the "Total Time Open" in a single attribute against the request in the table h_itsm_requests. This means that a calculation would be required (something like h_dateresolved minus h_datelogged to generate the number of seconds/minutes between the two values) which you could then perform an AVERAGE calculation upon. However, when creating measures, we do not have the ability to perform calculations like that - we can only query specific existing attributes. There is a field called h_fixtime but this records the time taken to resolve the request based on the SLA asscociated (so would incorporate your working time calandar hours, and not record time the request was on-hold etc) We may be able to create a Real Time widget (which would give you the average time open of all tickets at the point of time you are viewing it) but this is not a sampled solution so you would not be able to compare it to other days without manually recording this figure every day. So unfortunately I'm not sure if what you are after if going to be possible through Hornbill right now - happy to help if you have any further questions though. Kind Regards Bob
-
In this latest update, Team Hornbill have combined all of the fantastic new Service Manager features that were released in first two quarters of 2020, into a single update. If you missed some of these new features whilst they were being rolled out in the various Service Manager updates, please have a look at the link below for a refresher on this new functionality that is available to all subscribers right now. Here is a direct link to the latest edition: https://wiki.hornbill.com/index.php/Service_Manager_Quarterly_Update_2020_Q1/Q2 For links to our previous update round ups, please check out the Whats New Wiki Page
-
Hi @Josh Bridgens I'm not sure if this is possible at the moment - but just to get some more information about what you classify as "Age" Are you incorporating calls that are On Hold? Are you taking into account Work Time Calendars? Or is this literally "The average of how many Days/Hours old all of our calls our, regardless of anything else?" Kind Regards Bob
-
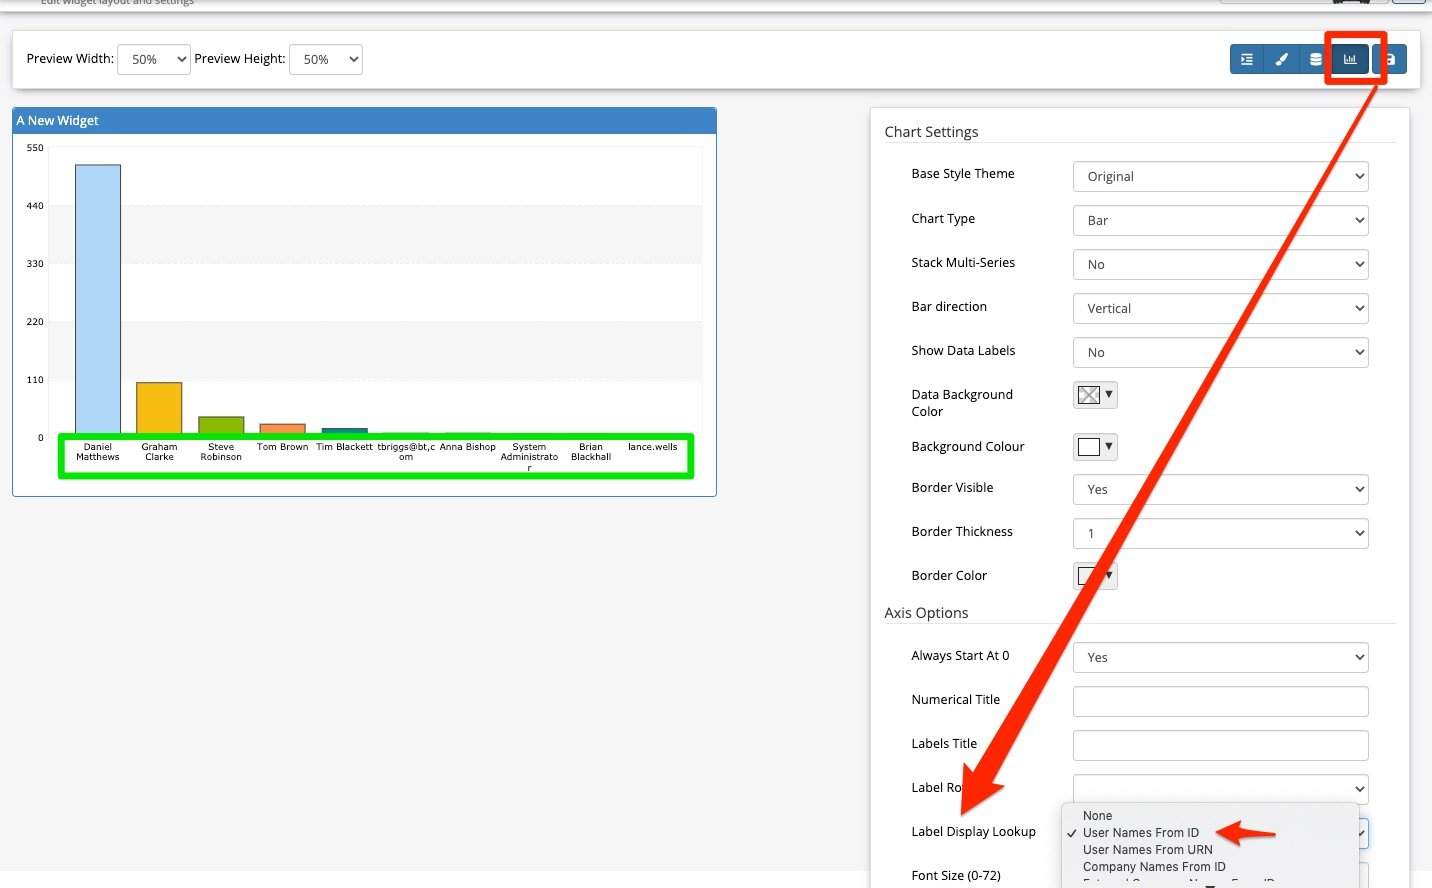
Hi @Alisha When you are creating your widget, if you click on the "Chart Settings" button, you should see an option called Label Display Lookup. Because h_createdby is the User ID, you need to select the option: "User Name from Id" This should then map all of the user IDs to their real names and make it look a lot nicer. Hope this helps Bob
-
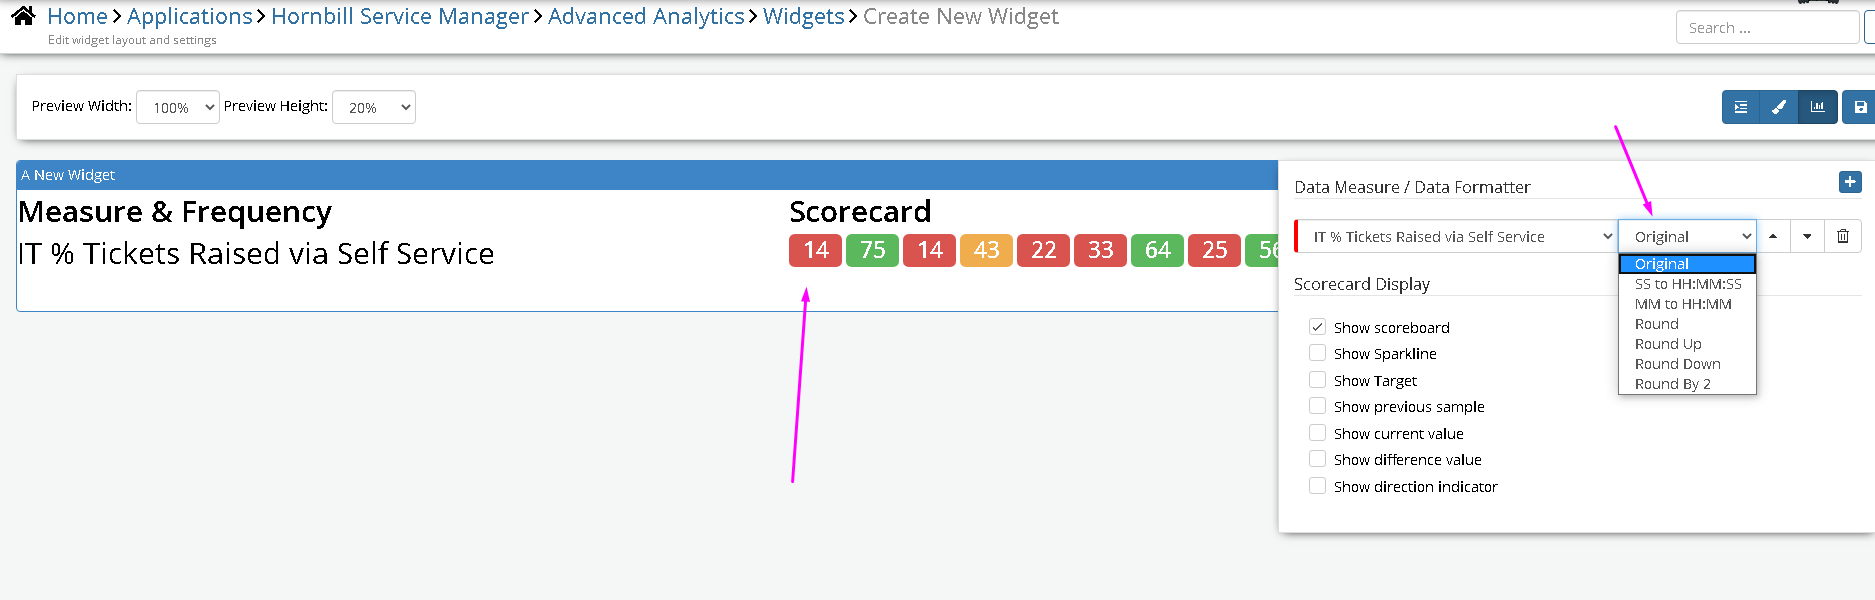
Hi @stepghg I don't think you can do any formatting on the view of the raw sample results within the measures screen. But there are some things you can do if you are using this data and showing them as widgets. For example, I've taken a measure here - and created a "Scorecard" widget (that pretty much looks the same as the result you get in the measures screen). From here you have a few formatting options, including the ability to round up/down the decimals places: Hope this helps Bob
-
Request Reassign Post SLT failure
Bob Dickinson replied to AndyGilly's topic in Performance Analytics
Hi @AndyGilly Nice idea for a report - I've not built this one before, so have given it a go. I've put in some date criteria (basically any reassignments that have happened since the start of Last Month and the Today) but feel free to play around or remove this in the filter section of the report. Upload it using the green button in your reports section, and let me know if it does the job. PS - Ignore the preview if it looks like the Previous Team Name and Assigned Team Name are the same...this is just a preview bug, when you actually run the report the data should hopefully show correctly. Kind Regards Bob incsr-reassigned-team-after-breaching-resolution-sla.report (1).txt -
@Martyn Houghton Not that I'm aware of, the above tip is for individuals mentions only
-
@Martyn Houghton @samwoo This isn't exactly the answer to your query (as you rightly suggest, what you are asking for is a feature request). But one alternative that could be used in certain scenarios is to use an "Update Timeline" node in your business process, and you can actually add logic to the content to mention individual users (e.g. the equilivilent of typing "@Bob" in an update). Doing this will also result in them receiving the Hornbill Bell notification to say that have been mentioned. To do this, you can use this logic: {"<name>","urn:sys:user:<userID>”} so for example, to mention me it would be something like: {"Bob Dickinson","urn:sys:user:bobd”} Then you can get even more clever and inject variables from your BPM into the logic. So for example, if I wanted the BPM operation to mention the current owner of the request, I would inject the owner variables as follows: {"&[global["flowcode"]["owner"]]", "urn:sys:user:&[global["flowcode"]["ownerId"]]"} As mentioned, not the exact answer but it might give you some inspiration about other ways of achieving the requirement if you weren't already aware of this. Kind Regards Bob
-
query? SQL Distinct Widget or Measure
Bob Dickinson replied to Martyn Houghton's topic in Performance Analytics
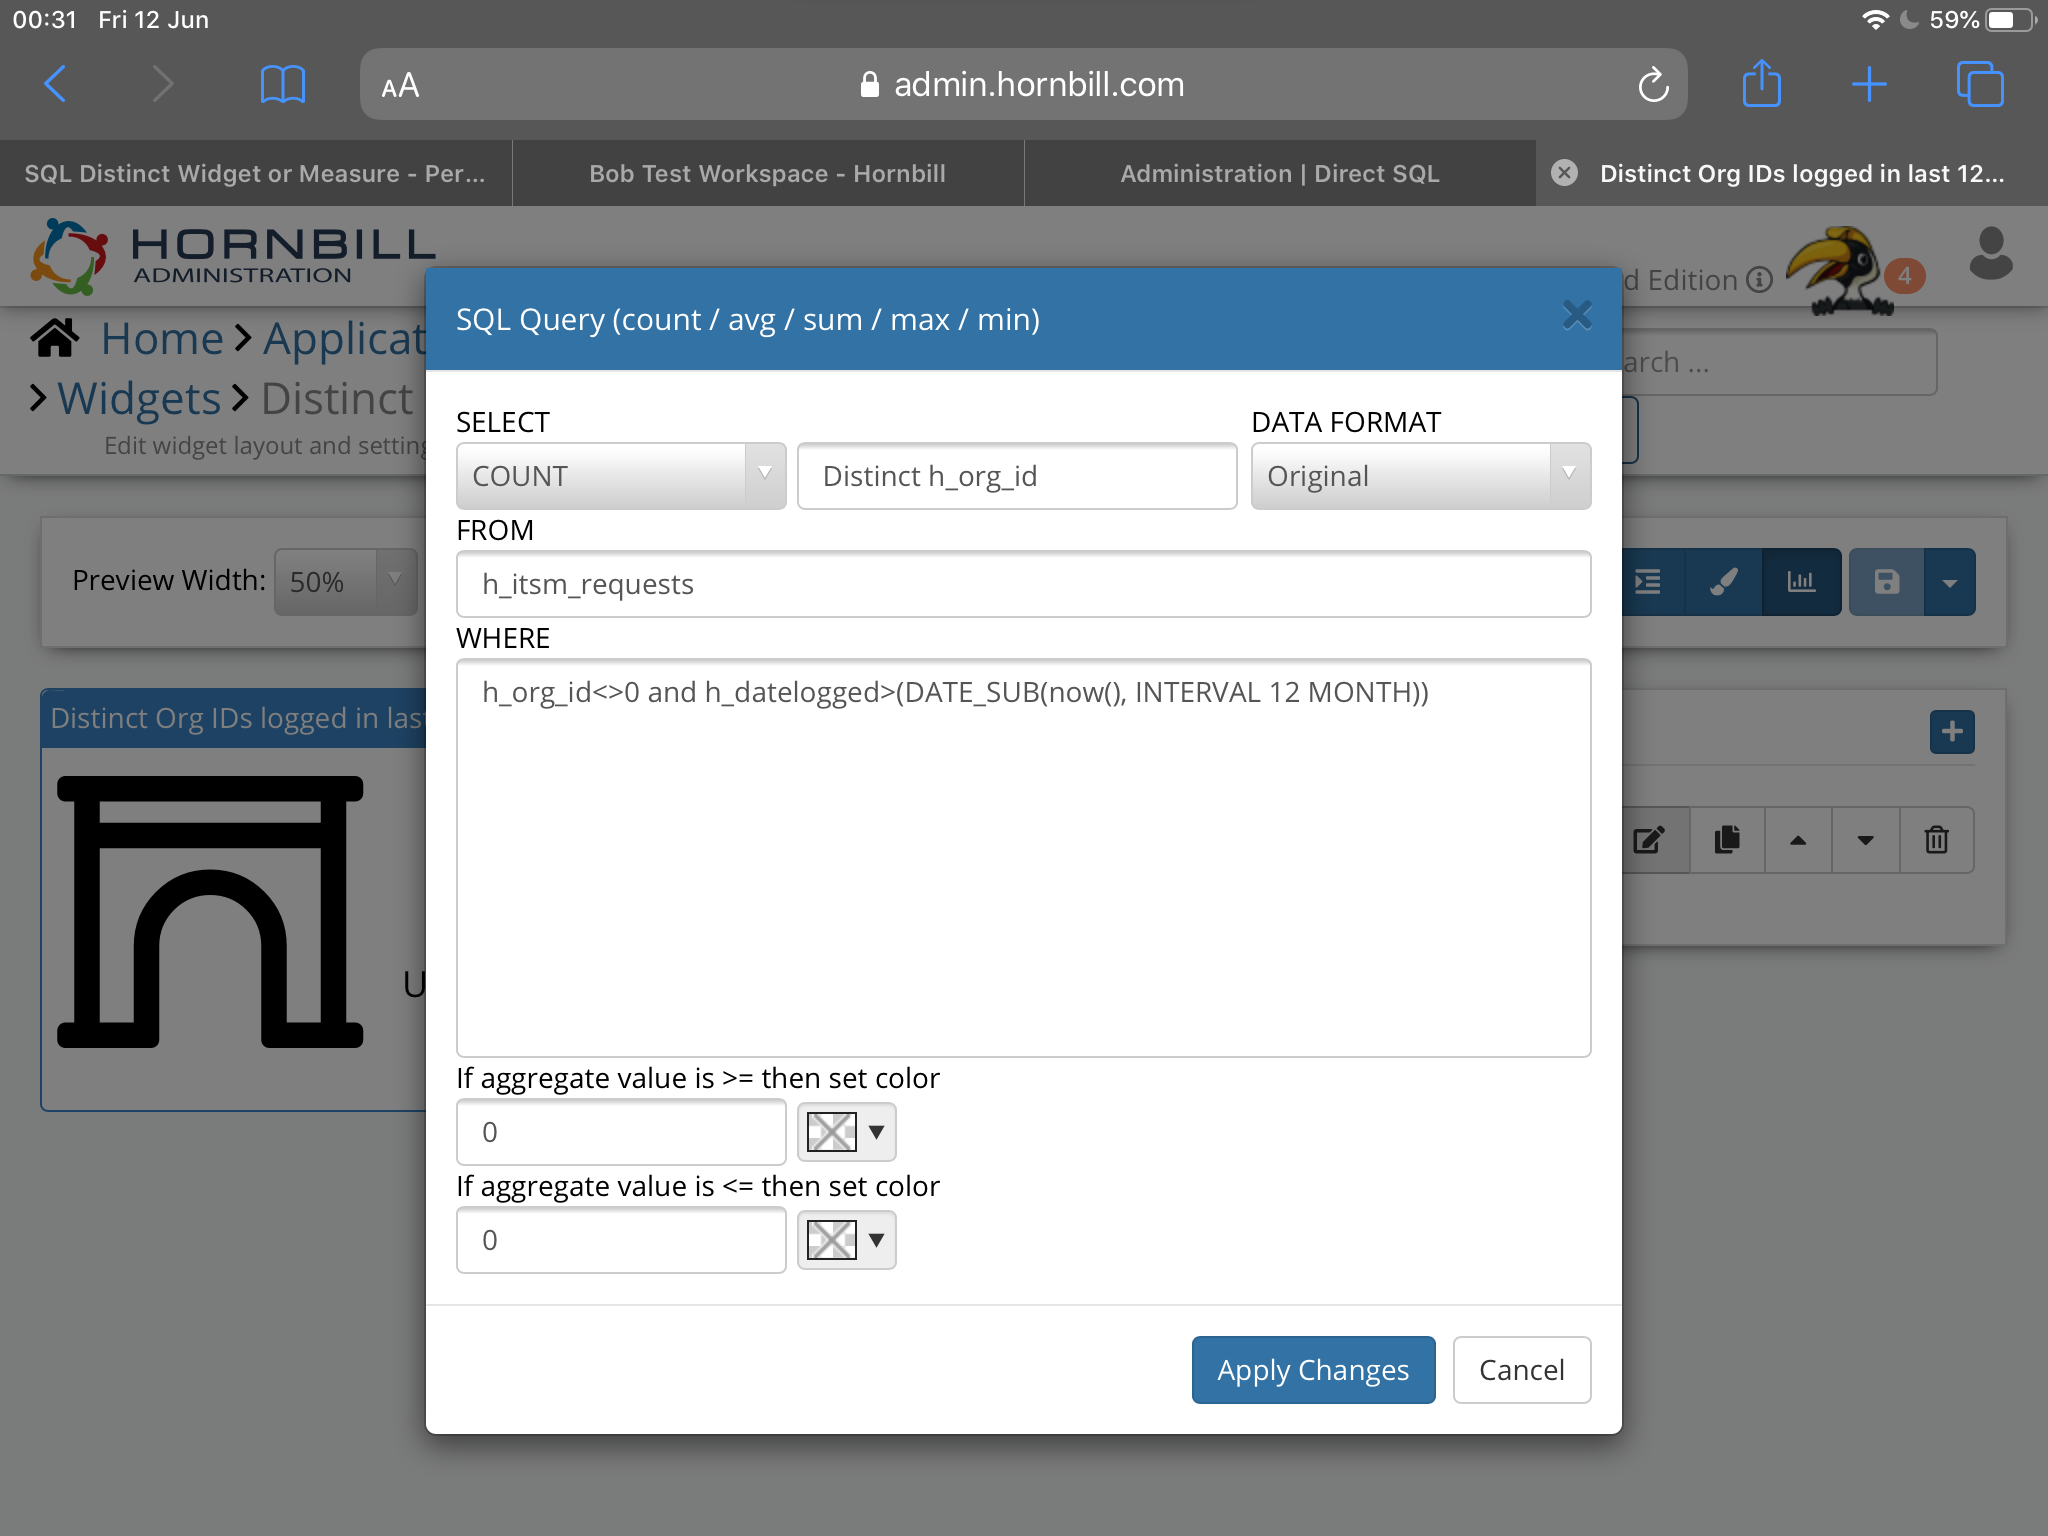
Hi @Martyn Houghton As a starting point, you should be able to do this on a list of counters widget relatively easily - I don’t have a huge dataset, but believe I have this working with the following set up: Kind Regards Bob
-
Hi @chrisnutt Did you have any luck with fixing this? Kind Regards Bob
-
@Michael Sharp Good to hear - and that's some interesting feedback, thank you. I'll suggest that to other customers we are onboarding and get their views to see if that's a common theme
-
Hi @chrisnutt I'd suggest best practice would be to enforce catalog item selection, as it genuinely makes the layout and structure of BPMs far easier to understand and maintain. However I do appreciate that is easier said than done if a configuration has been performed in a particular way already and you are live. So in your example I'd have another decision node - after the Estates service decision, that is look to see if a Catalog Item has actually been selected or not. If yes - dynamically switch as per my example in the last post. If no - switch to the defined progressive capture (as you have it set up right now) That would cover all eventualities I believe. Let me know how it goes and if this works for you
-
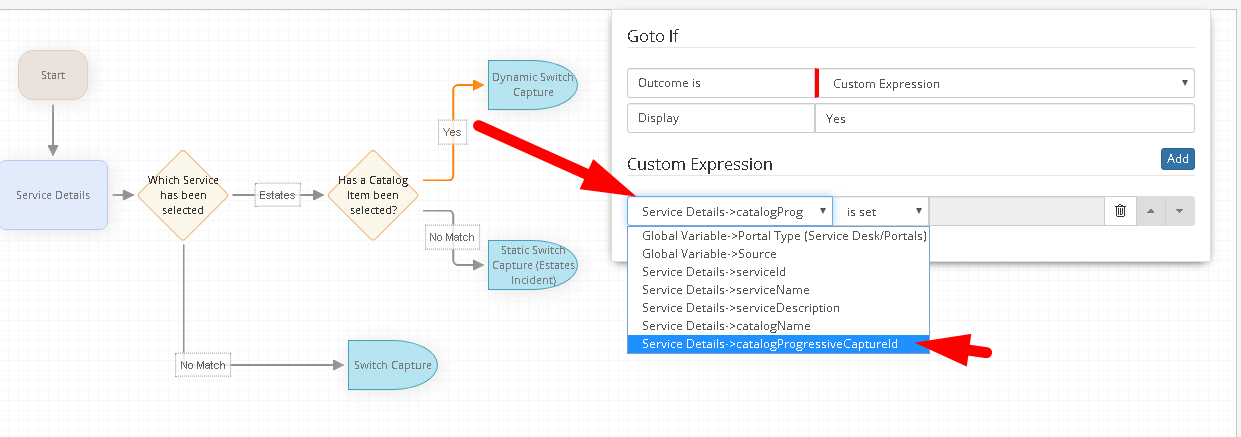
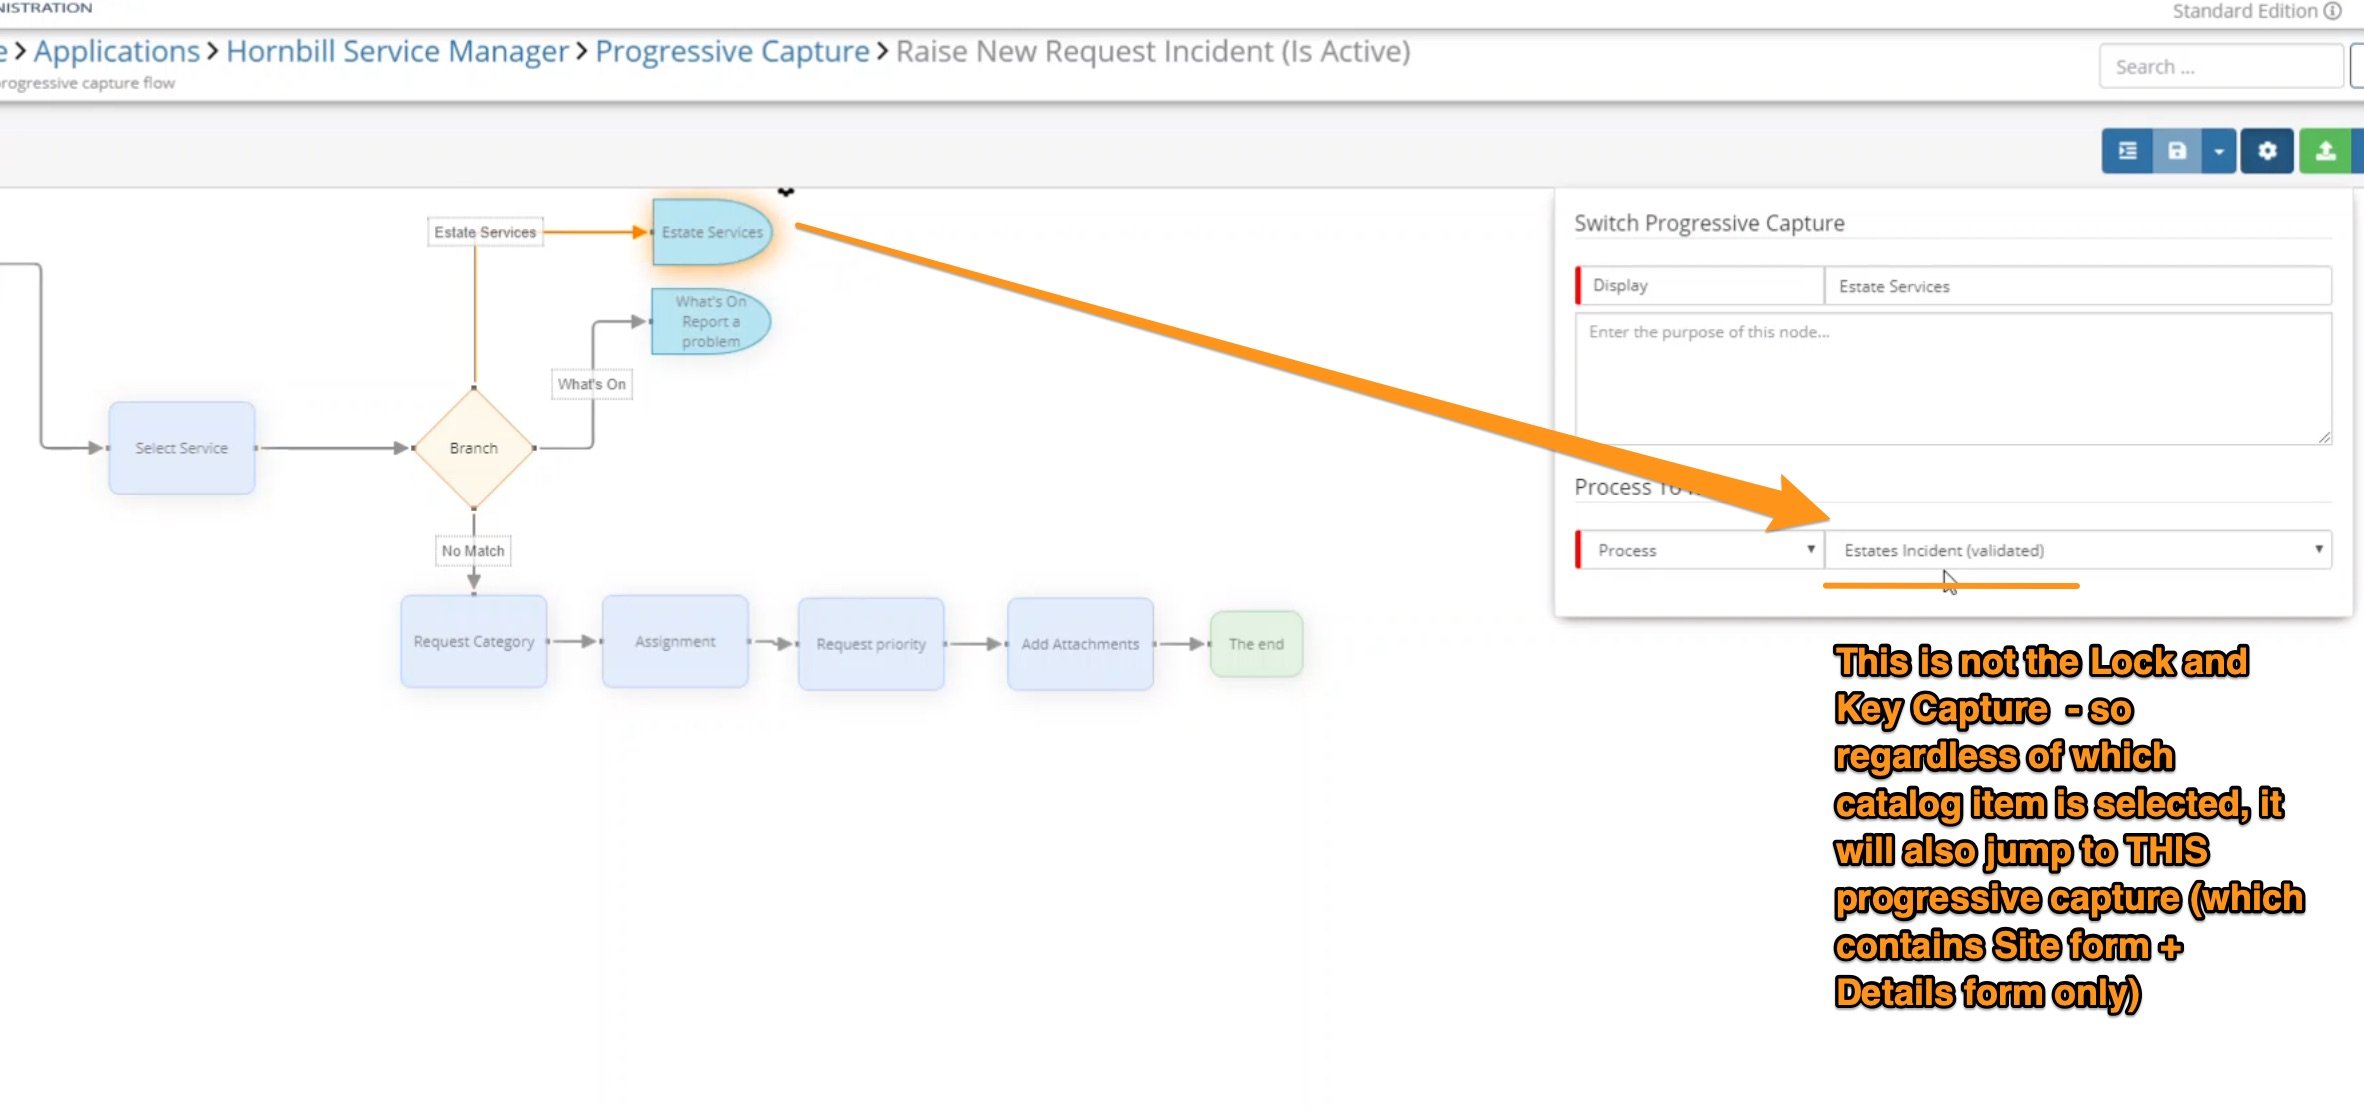
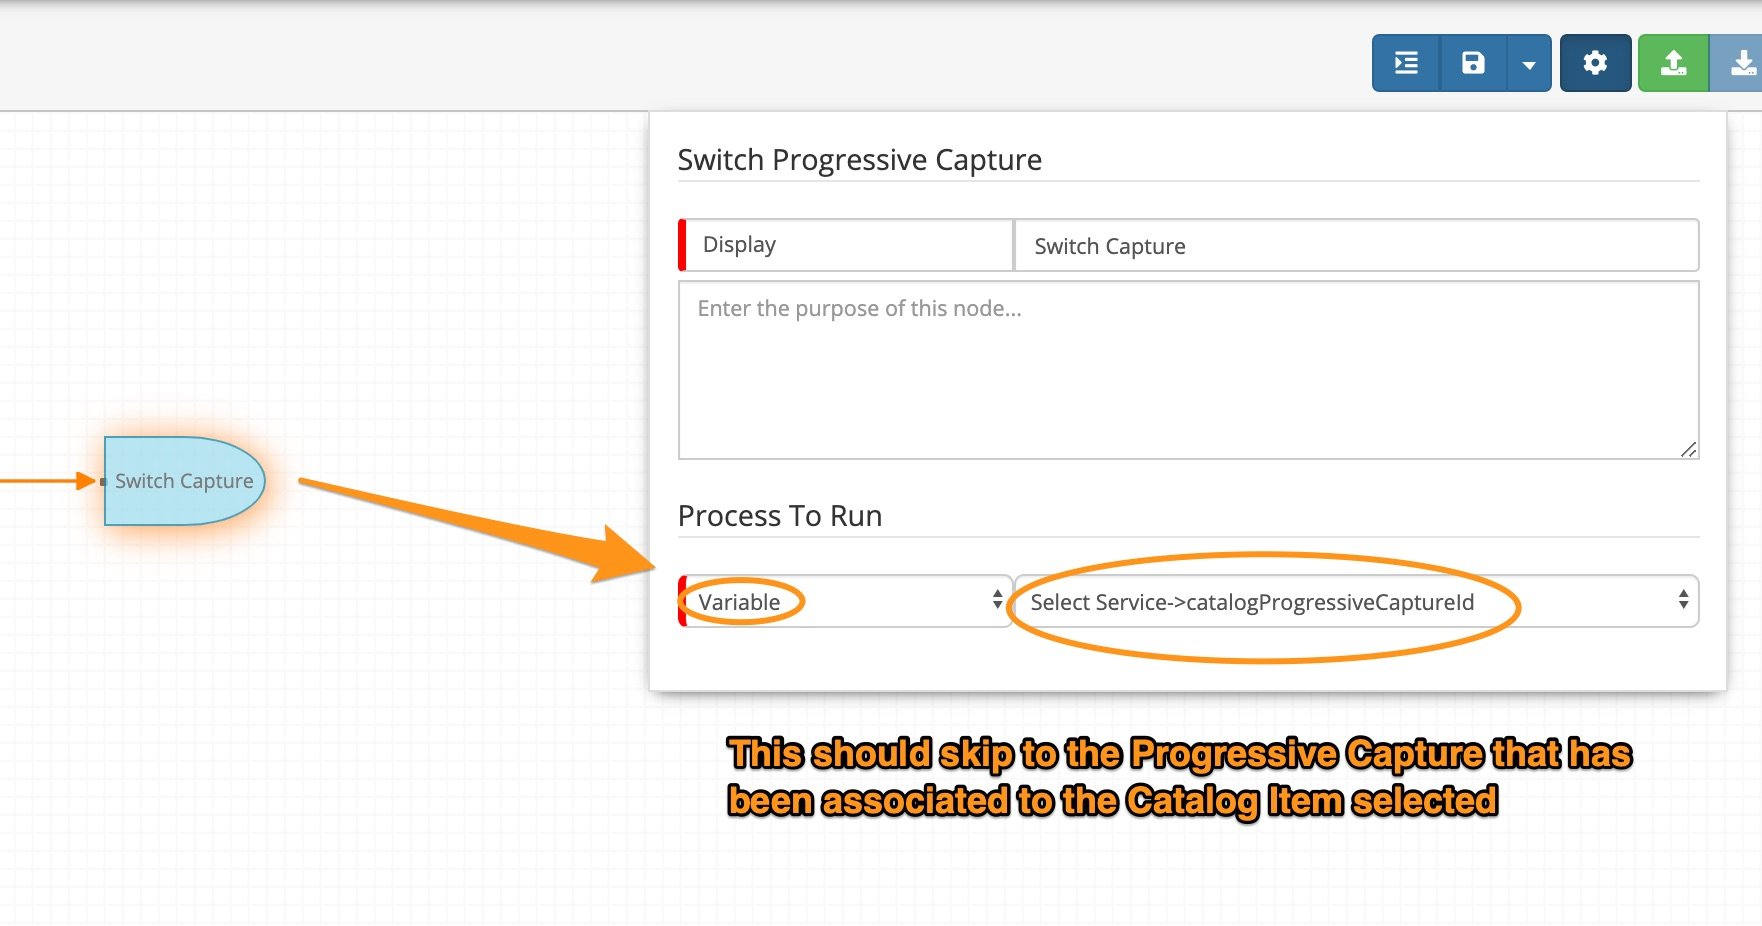
Hi @chrisnutt I've had a look at your video, and I think I can potentially see the issue (it took me a few watches!). From what I understand; if the Estates Service is selected, along with a Catalog Item - you would then like to Switch to the Progressive Capture related to the Catalog Item. You have a number of catalog items, some with their own captures (for example Lock and Key). However from what I can see - after the decision to establish whether the Estates Service has been made - you have specifed a specific capture that will ALWAYS been switched to next in this scenario - called Estates Incident. Estates Incident contains two forms - the Site and the Details. This means, that even if you select Lock and Key, it is always switching to Estates Incident....and never your Lock and Key specific one: What I believe you need to do, is change this Switch Capture node to dynamically be switching to the Progressive Capture asociated to your Estates Catalog Item that was selected. To do this, change the Switch Capture node above, to be configured as per below: Give that a try, and raise some requests against a few catalog items, including Lock and Key. Hopefully this will Switch as you expect. I may have misunderstood this - so if it fails for whatever reason, please switch it back to the current set up and let us know and we will take another look. Kind Regards Bob
-
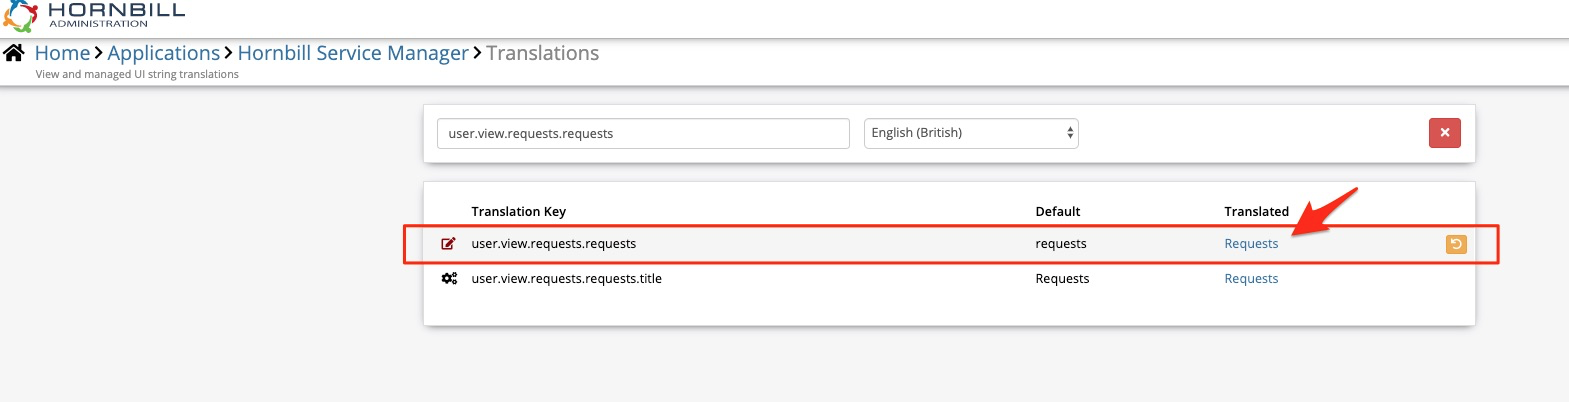
Hi @Michael Sharp We will get this amended so it's capitalised by default. But in the mean time for an immediate fix, you can simply update the translation string in the admin tool (under the Service Manager translations) The string you need to search for is: user.view.requests.requests From there you can change it to the correct case. Hope this helps Bob
-
Hi @Michael Sharp I've had a look at this, and I'm not sure it's possible to achieve exactly what you are looking for in the form of a Scorecard. I'm just investigating if there is anything clever we can do using a combination of the "Count" option and the WHERE clause and will get back to you. Kind Regards Bob
-
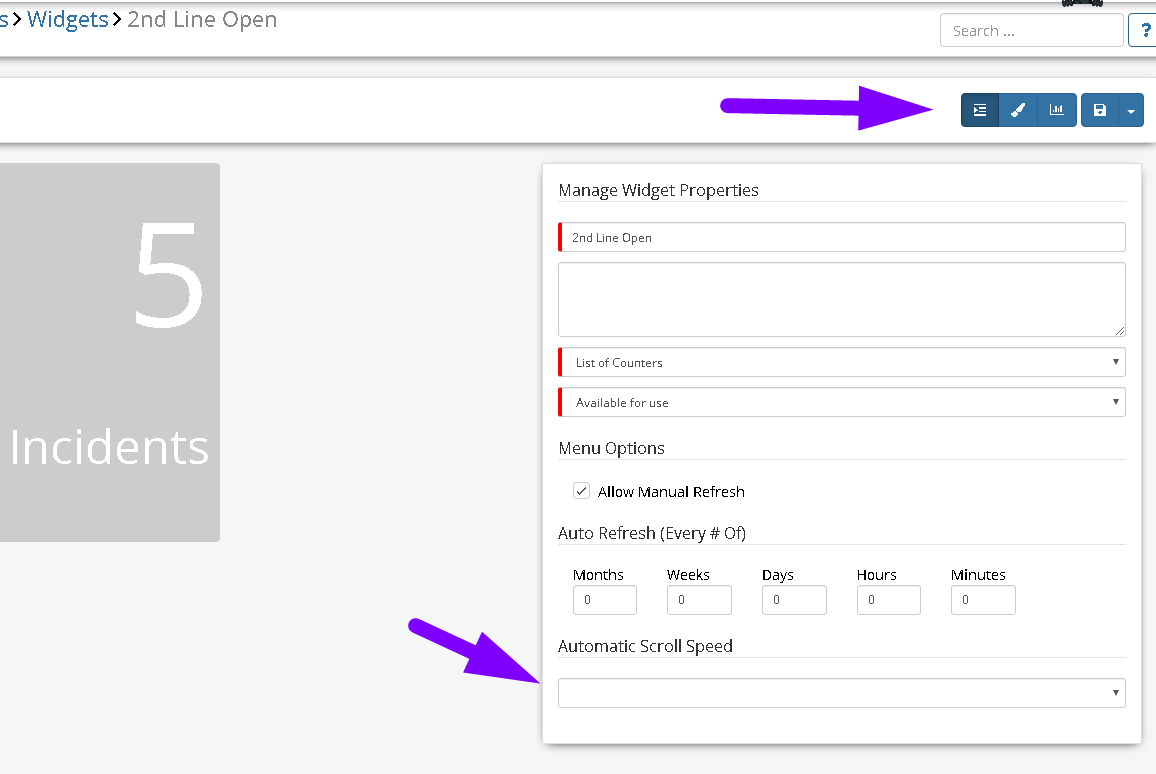
Hi @AndyGilly If you open up one of the affected widgets (not the dashboard), when you look at the widget properties (e.g. the name and status) do you have anything set under this scroll speed setting? My fear is perhaps this may have been set for one widget, and perhaps it was copied to others during the build of widgets as part of your implementation. If that is the case, the only way to resolve this is to go into each on and select the "off" option (and save) But let me know if this is set or not Kind Regards Bob
-
Hi @AndyGilly It might be because it's early on a Monday morning, but I can't see any difference in the order of the items in each widget in that screenshot? Is there a specific widget that is changing the order of the individual counts or is this happening on all of them? Thanks Bob
-
Advanced Reports - Timeline Update column not updating
Bob Dickinson replied to Daniel's topic in Reporting
Hi @Daniel Unfortunately we do not have the ability in the Reporting Functionality to extract this report in the format that you require it (as this involves some complex SQL to achieve). This is certainly something that we will look to add as an "Out of the box" report in the future using our in-app reporting. In the meantime - as a workaround we have been able to provide the SQL that would be required to gather this information from Database Direct on an ad hoc basis. Obviously this cannot be scheduled or exported to a PDF (CSV only), but if you are looking to get the data out of Hornbill, this is a potential way of doing it. Please keep in mind that as this is covering a large dataset, we would advise adding date criteria, a results limit and/or other filtering to keep the results to a minimum wherever possible - and this should only be run/refreshed infrequently (i.e. not every few mins) to prevent any potential performance issues. SELECT h_itsm_requests.h_datelogged , h_itsm_requests.h_pk_reference , h_itsm_requests.h_fk_user_name , h_itsm_requests.h_summary , h_itsm_requests.h_description , h_buz_activities.h_content , h_buz_activities.h_updated , h_itsm_requests.h_ownername , h_itsm_requests.h_fk_priorityname , h_itsm_requests.h_status , h_sys_groups.h_name FROM h_itsm_requests JOIN h_sys_account_groups ON h_itsm_requests.h_fk_user_id = h_sys_account_groups.h_user_id JOIN h_sys_groups ON h_sys_account_groups.h_group_id = h_sys_groups.h_id JOIN h_buz_activities ON h_itsm_requests.h_activity_stream_id = h_buz_activities.h_target WHERE h_buz_activities.h_id = ( SELECT bAb.h_id FROM h_buz_activities bAb WHERE bAb.h_target = h_buz_activities.h_target ORDER BY bAb.h_ustamp DESC LIMIT 1 ) AND h_sys_groups.h_type = 2 AND h_itsm_requests.h_status IN ('status.new', 'status.open', 'status.onhold') AND ( h_sys_groups.h_name = 'Scheduling and Business Support' OR h_sys_groups.h_name = 'Repairs' ) ORDER BY h_itsm_requests.h_datelogged DESC I hope this helps Kind Regards Bob -
Advanced Reports - Timeline Update column not updating
Bob Dickinson replied to Daniel's topic in Reporting
Hi @Daniel Could you download your report defintion from Hornbill, and send it to me via a private message if possible? I'll take a look to see what is happening here? Kind Regards Bob
-
HI @Alisha I think this might be because when you use a Not Equals operator, it also removes any values that are NULL. So if you don't use any other substatuses in this result set (i.e. every substatus is either "With Third Party" or Empty) - then the filter you've used above will result in 0 results. Try this - and see if it gives you a count closer to what you would be expecting: WHERE (h_sub_status != 'With Third Party' OR h_sub_status IS NULL) Let me know if that works Kind Regards Bob
-
Hi @Michael Sharp No problem, I hope some of the suggestions have helped. I've heard back from the developers and unfortunately my comment yesterday was confirmed - the Online Status of the users is managed in the process cache (for performance reasons). This means this data is not available in a table like the other statuses, so it's not something we can put on your dashboard in the same way as the other ones I've posted. In terms of the widget on the Employee portal requiring a refresh - this is something I will let @Daniel Dekel answer as I don't know what options we have around this. Kind Regards Bob
-
Hi @Michael Sharp You are right - the status in my widgets is the Availability Status that an analyst can set themselves. I don't believe that the status you are after (the Online Status), is actually stored in a table that you can report upon. I am just speaking with the developers to double check this - I should know for sure in the morning, and will let you know. In terms of of the second widget - yes, I didn't put any filter in to prevent archived users from appearing. Please replace the SQL text with the below statement instead, and this should only display the analysts who have not be suspended or archived: SELECT a.h_name AS USER, b.h_name AS Status FROM h_sys_accounts a JOIN h_sys_accounts_status b ON a.h_avail_status = b.h_status JOIN h_sys_account_groups c ON a.h_user_id = c.h_user_id WHERE c.h_group_id = '1stLineSupport' AND a.h_account_status = 0 ORDER BY b.h_name, a.h_name Kind Regards Bob
-
Hi @Michael Sharp In your screenshot, I think you might have accidently click the "Enable" button for the Series. If you click "Disable" it should collapse that part. And you should have another section appear called "Data & Label colour pinning". Click "Add New", and putting in the same mappings that I did as per my screenshot/the demo widget, and it will hopefully work. And I've just created the other widget on the demo kit. Its called 1st Line Support Analyst Status - Per Analyst and can be found here: https://admin.hornbill.com/demo/app/com.hornbill.servicemanager/analytics/widgets/75768b2a-9ee6-415e-bf4a-1aa9ddbbb919/
-
@Michael Sharp I have replicated this on the Demo instance (and changed the date format so you don't have the truant mandatory field). It's called 1st Line Support Analyst Status or you can click this link: https://admin.hornbill.com/demo/app/com.hornbill.servicemanager/analytics/widgets/46a73cbd-0fcc-47d8-e879-ddf4e51782d1/ (Please be aware that this will be wiped at Midnight tonight as part of the demo instance data refresh) Kind Regards Bob