dwalby
-
Posts
559 -
Joined
-
Last visited
-
Days Won
1
Content Type
Profiles
Forums
Enhancement Requests
Posts posted by dwalby
-
-
+1 for this idea
-
Hi All,
I'm hoping to create a widget/report which shows the average time to resolve on the Y axis and Category on the X axis of a bar chart. Any suggestions on how to achieve this?
Thanks in advance
-
@Daniel Dekel I've checked both of these, I'm the owner and member of the Problem Management Workspace and notification settings are as above.
-
Hi all,
I have 3 Workspaces; Incident Management, Problem Management & Change Management.
Currently I only seem to receive notification of updates within the Change Management Workspace, despite Notifications being enabled in the Incident Management and Problem Management Workspaces. Is there another setting that needs to be enabled?

-
@Daniel Dekel Excellent news! Well done on getting this in place - something we've been patiently waiting for!

-
 1
1
-
 1
1
-
-
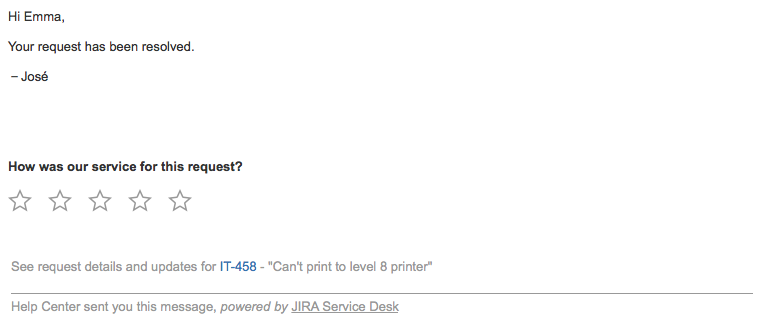
Funnily enough, I came back here to see if there had been any further development on this. I think it'd be a massive improvement if the customer could click on their desired rating directly from the e-mail to submit it, similar to the below. Is there any possibility of this as a future enhancement?

 20 hours ago, SJEaton said:
Or any more development on something like this??!
Sam
-
 1
1
-
-
@Steven Boardman Thanks Steve, yes I use routing rules - I've enabled the setting.
-
Hi all,
We have an 3rd party external supplier who we raise support requests with, when raising the request with them we use the mailbox within Service Manager and put the Incident/SR reference in the subject. Is it possible to automatically update the request in Service Manager with their responses?
I have them setup as an organisation in my instance with the support e-mail address saved.
Thanks in advance
-
@Conor thanks again, sorry to keep asking questions! I've had some further thoughts on this and now I want to set all users of the department2 OU to a particular manager - do I enter their full name or username?
-
Thanks again @Conor - does the below look correct? I hoping this will include all sub-OUs of Domain Users but exclude department2?
"Filter": "(objectClass=user)",
"DSN": "(&(OU=Domain Users,OU=Controls,DC=company,DC=ad)(!(ou:dn:=department2))",
"Debug":false -
-
@Conor - thanks, just to confirm the filter (&(department=12*)(!(department=123*))) can be applied to OUs?
14 minutes ago, Conor said:@dwalby there are 2 ways, the easiest is probably with this kind of syntax in the filter:
(&(department=12*)(!(department=123*)))
where & is 'AND' and ! is 'NOT', so in the above example it will select all users in a department labelled in AD starting with 12, and none from department 123. This way you would filter out the department that does not require the managers to be imported for the first import, and do the opposite for the second.
The second way is to set up the new import script to only import from the relevant OU by specifying it in the DSN part of the import script. This will mean that the new import only looks at the OU you want to exclude the manager import from, and imports those users separately from the main import. So the first import may be looking at `DC=test,DC=hornbill,DC=com` (with a filter to exclude marketing, and this import does import managers), whereas the second import will be looking only at `OU=Marketing,DC=test,DC=hornbill,DC=com` and this import script does not import managers.
Hope that helps.
Thanks
Conor
-
@Conor thanks and sorry for the late reply.
I've done some searching but can't see how to exclude the OU from my main LDAP script, are you able to provide any suggestions please?
-
Hi all,
Is it possible to present related incidents, requests, problems/known errors & FAQs once a request has been logged? Currently suggested related items are only shown during the logging stage. This would provide a quicker and easier way for analysts to link Known Errors, rather than having to manually link them using the Link action then manually searching.
I understand the Knowledge Centre is still in Beta/Development so this may be something already factored in to full release?
Thanks in advance
-
 2
2
-
-
Hi all,
Is there an e-mail variable for the scheduled change date for change requests? I'd like to automatically send an e-mail to notify interested parties of when a change has been scheduled for.
If not, please could this be raised as an enhancement?
Thanks in advance
-
Thanks, just updated
-
@Ehsan thanks for the response. I've actually just been through and deleted all of my charts and re-created them which now allows the dashboard to load. Once I've done the update though I'll try remember to re-create the issue by copying some views containing charts.
-
I think I may have identifies what triggers this issue actually... When looking at the Edit View settings of a custom view if you click Make a Copy button on a view that contains Charts it causes the dashboard to break. You can see a red error message appearing for a millisecond by selecting Charts within the Edit View section. Assuming this might be the cause of the issue.

-
@Mohamed has there been any further progress on this?
-
@Steven Boardman could this be done in conjunction with some Wiki markup to show images, etc? Might be useful for the OP if so.
-
Hi all,
I'd like to create a widget which shows the number of requests open, logged (created by) and resolved per analyst in a bar graph, similar to the below. Is this possible? I've tried a Measure Group By with multiple series, but it doesn't seem to allow different group by filters to be applied, i.e. Created By for Logged requests & Owner name for Open requests. Any help appreciated

-
I've seen a similar issue to this where the spacing between words is removed when viewing an email that was sent in the request timeline.
-
5 hours ago, James Ainsworth said:
Hi @dwalby
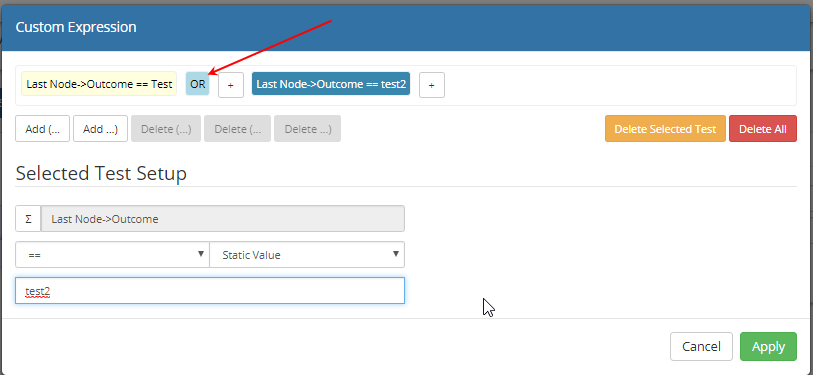
Have you tried only having one of these and using the OR option to specify your different criteria?
Hi @James Ainsworth this was one of those embarrassing moments where minutes after posting I realised I could use the OR/AND functions! Thanks
-


Request Details (inc. Custom fields) visible in Service Portal
in Service Manager
Posted
Hi all,
Is it possible to display the request details and any custom fields in the Service Portal? Currently it seems to be limited to Summary and Description.
Thanks in advance