
Adambingley
-
Posts
38 -
Joined
-
Last visited
Content Type
Profiles
Forums
Enhancement Requests
Everything posted by Adambingley
-
Hi Dave, This would save a create deal of time, however, when raising a change from a SR, no details appear to be copied over? It links the request and shows that the source of the request came from an SR but doesnt pre populate any details. Any ideas? Best Regards Adam
-
Hi All, Hoping to post for some advice regarding service requests that are ultimately requests for change and advice on how to action/streamline these requests. According to ITIL, any such change, should be recorded as a CR, however, as we do a lot of in house development, we get a lot of change requests that come in via service requests. This causes my IT staff to pull their hair out because they are literally wasting time re-typing out change requests from a service request. Anyone have a better way? Or should we simply allow low risk/standard changes to be resolved via SR to lower the amount? IT would be Ideal if an SR could be converted to a CR as some ticketing systems allow. Thanks Adam
-
Service outage across several instances [RESOLVED]
Adambingley replied to davidrb84's topic in Service Manager
Hornbill is currently down for us, are you experiencing any problems? Thanks Adam -
dev-request Prevent customers from commenting on closed requests
Adambingley replied to HHH's topic in Service Manager
I second this. It's very frustrating when customers respond resolved tickets without re-opening and closed tickets expecting a response. Not sure exactly how this would work if the customers simply respond to the resolution e-mail. -
It appears this has now been resolved in the latest update.
-
Hi @ArmandoDM I didn't have any relationships, didn't know they even existed or needed to be set up. I've done as per your screenshot but changed the type names accordingly and it seems to be working, presumably the type name has to be "Caused by" in order to show on the report? Thanks Adam
-
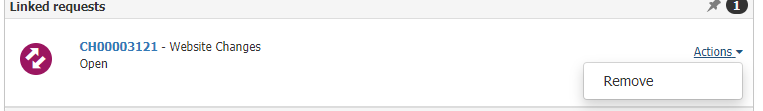
Hi David, How do you change the relationship of a linked change request, I don't appear to have the ability to set that? See screenshot below. Thanks Adam

-
HI Gerry, I appreciate you taking the time for such a thorough response. The export tool will certainly come in handy, especially if its something I can automate so i'll be looking into that shortly. With regards to the personal dashboards, I did create my first dashboards yesterday but found a bug, James Ainsworth has had this checked by a developer and they confirmed that there is a discrepancy between the "View" data source and "Chart" data source even though it should be the same. Once this has been fixed, I'm sure I'll be able to use them as expected. I'm quite shocked the issue was not spotted before considering it was the first dashboard I'd created but at least it will be resolved in the coming weeks. I understand that you have to provide a tool that's usable for a wide variance of skills, you can't expect someone with little analytical knowledge to perform complex SQL and i appropriate that. There are some obvious changes for me that would really help with the standard reporting you already offer: As a real life example, "Avg response time" & "Avg Fix Time" reports shows anomalous values but as I cannot identify what's causing these issues it makes the reports unusable, being able to drill down or preview the background data from the report would be required to figure out what's going on here and would be required in general to be able to investigate issues. A friendly English wording of the criteria would also be helpful rather than the outright SQL. Thanks again. Adam
-
Brilliant - Thanks!
-
Thanks James, I'll take a look at the export tool, that will probably do the job! Just on one report that you missed, "Requests caused by change", what actually flags this to show on the report? is there a resolution category we need to be using to flag this? Best Regards Adam
-
Thanks for letting me know James, hopefully it doesn't take too long to implement.
-
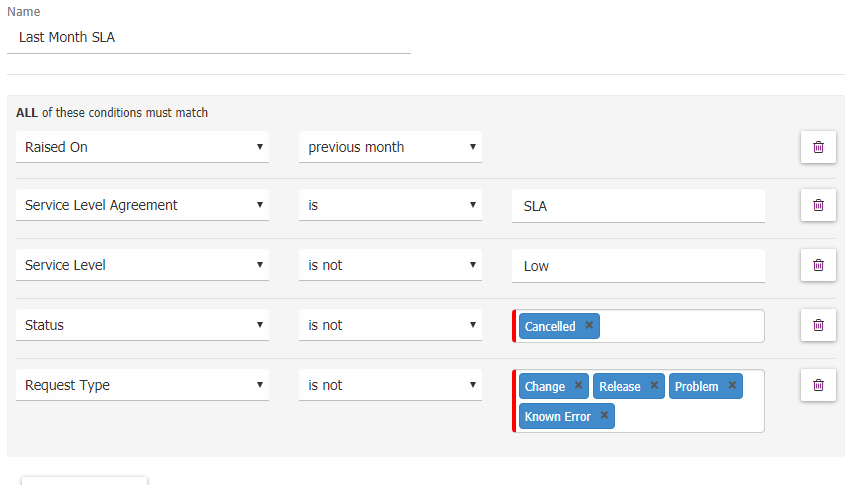
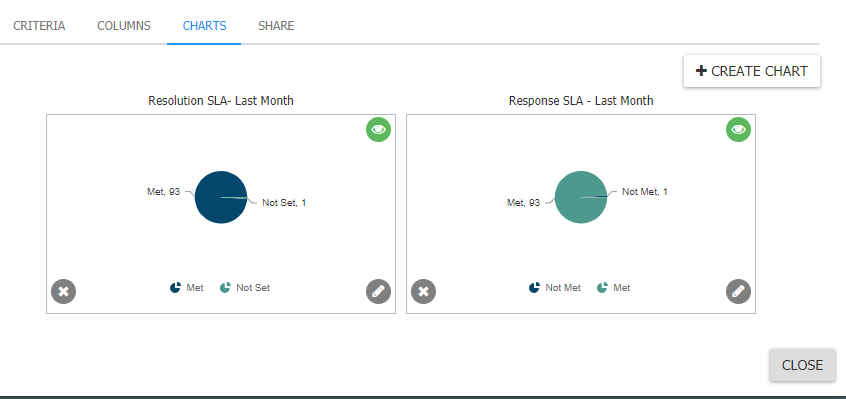
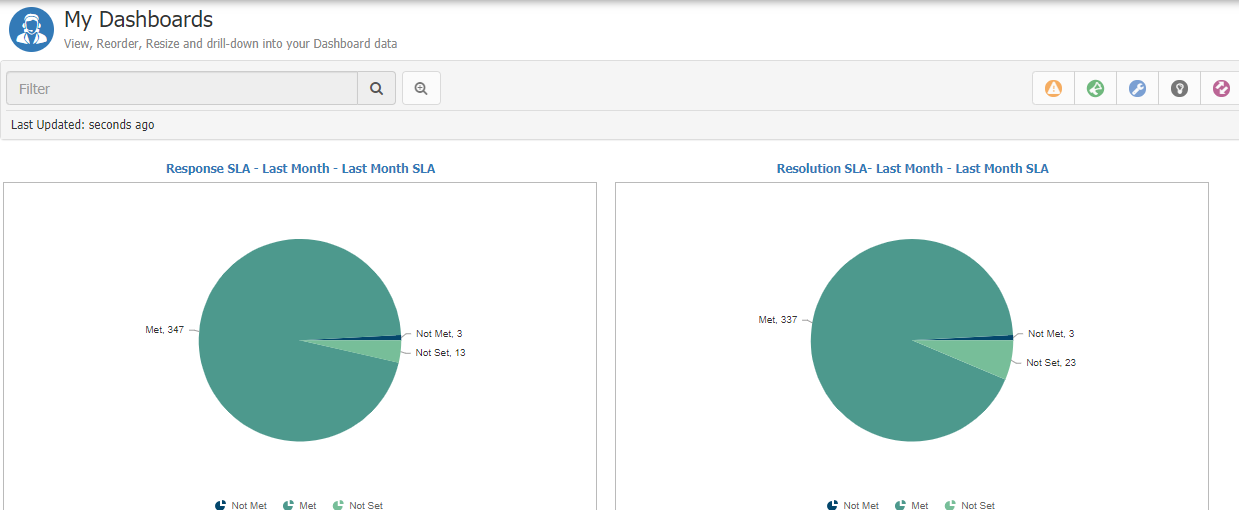
Hi All, I believe the following is a BUG but there doesn't appear to be the option to log this in the service portal. I have created two charts based on a request view in service manager, when previewing the charts the data's correct, when viewing them in the dashboard vie the data does not seem to reflect the criteria set against the view. The problem seems to be using the "Raised On" condition, if this is set to "Previous Month" it doesn't work, if set to last 30 days it works. Its very odd. Screenshots shown below, View Criteria: (Returns 94 total requests) Chart Preview (Shows 94 requests correctly): Dashboard View: Shows incorrect data, there should only be 94 requests in total but the following is showing 363, when the segments of the chart are clicked, the drill down data is correct. as an example, there is currently 1 request in "Not Set" not 13.
-
Good Morning James, Thanks for your response. I'm fairly well versed in SQL (Oracle OCA in SQL) so generating the reports from data perspective is fairly straight forward but as you cannot use SQL to generate reports using the clunky front end is painful, especially when you cant easily run the query then edit like you can in SQL. Currently, I use the database direct to export the requests into a CSV then import into an Oracle database, I have pre-created various reports that I can run which is very time consuming hence why I posed the questions. The Service manager reports are a step in the right direction but as you cannot see the criteria behind them, most are pointless, there's also nothing on SLA's which should probably be the no.1 report. As an example, "Requests caused by change" returns nothing for me which means I'm not flagging the tickets correctly but how am i supposed to know how ? Also, "Avg response time" & "Avg Fix Time" has anomalies from test tickets etc which skews the data but as you cannot filter these out they make the reports unusable. Could you not display the reports SQL and potentially allow the "WHERE" clause to be editable? This would make the tool far more useful? With regards to Power BI, we use Tableau, and, although i'm aware that you can use R script, it doesn't appear to be anywhere near as easy to use as as in Power BI, if you have any information on using Hornbill with Tableau then that would be most welcome. Just from an outside perspective, we are in the process of rolling out a help-desk ticketing tool for various other departments (not ITSM) and we had 15 demonstrations from various platforms before finding the right fit, every single one had better standard reporting and most had dashboards covered under the standard cost all of which cost less p/m than hornbill which was very disappointing for me to find out. I know you do offer some dash boarding from your Advanced Analytics but its 50% of our monthly bill just for a feature which should be included in the cost, the monthly cost of AA should include reports to be "built" for you on demand & support but I feel that the features should be covered under the standard cost of service manager. Thanks Adam
-
Hi All, Wondering if anyone has managed to connect Tableau to Hornbill and if so please do tell! Best Regards Adam
-
Hi All, Wondering if any of you kind individuals could help. We have been utilising Hornbill service manager now for 7 months and although I believe its a great ITSM service desk tool, the reporting is down right appalling and the advanced analytics cost is extortionate for a small team. Could anyone share their standard reporting definitions for a few basic reports, the front end is massively clunky to get used to and its proving very time consuming. I'm looking for the following but ANY would be most welcome. 1. SLA reporting by month. 2. Tickets Logged / Resolved by month. (Ticket Volume) 3. AVG Resolution times 4. Incidents caused due to change. (&How do we flag incidents as caused due to change?) 5. Individuals Performance 6. Unplanned Changes by month 7. Incident Report For Incident/problem management Best Regards Adam