
dwalby
-
Posts
559 -
Joined
-
Last visited
-
Days Won
1
Content Type
Profiles
Forums
Enhancement Requests
Everything posted by dwalby
-
@Victor Thank you very much I'll check this out
-
Thanks @Steven Boardman - that sounds like a sensible option and would be a useful feature for us.
-
@Victor - Were you able to access my instance OK?
-
Hi all, Would it be possible to display a mini dashboard/HUD within the request list view? For example, for my analysts they have KPI/SLA targets which require them to have 85% within fix rate, a maximum number of open requests, max number of aged requests, etc. It'd be a useful feature for them to see their progress against KPI targets, rather than having to manually switch to the dashboard view each time. Just an idea, not sure how many others would benefit from this or whether it'd be considered for development. Thanks in advance
-
+1 for this - being able to bypass the completion of the checklist can lead to tasks being missed, essentially making the checklists irrelevant.
-
@Victor - Yes please proceed, thank you.
-
Thanks @Steven Boardman
-
@Steven Boardman I've amended the INC/SRs resolved per month to the below: But now the results are returning the same value each month. I thought this would return no. closed calls in April, March, etc. with different values?

-
Thanks @Steven Boardman
-
@Steven Boardman Thanks, manually setting this may work for us as we're currently not using approvals, etc. Do you have any pointers on how to tweak the import script to exclude manager mapping for a particular department/set of users? I've also just realised that the LDAP 2.0 utility has been deprecated in favor of 3.0 and now has the config file options within the Hornbill instance.... will have to check this out also.
-
Thanks @Steven Boardman but unfortunately this won't work for us at the moment as the 'power' users are not the managers of the staff raising requests. We use LDAP to sync users within Hornbill so managers are picked up from AD. Could I manually set the 'power' user as the manager of the department users or will this be overwritten at LDAP sync?
-
@Steven Boardman - Is there a timescale against this story? I have a growing number of 'power' users who are responsible for tracking IT issues and requests within their department who are requesting this functionality. For the meantime I've created a report that shows the request references, summaries, etc. however they've mentioned this isn't particularly useful as they are unable to see the progress and call diary.
-
Just realised I posted this in the wrong section - reposted here:
-
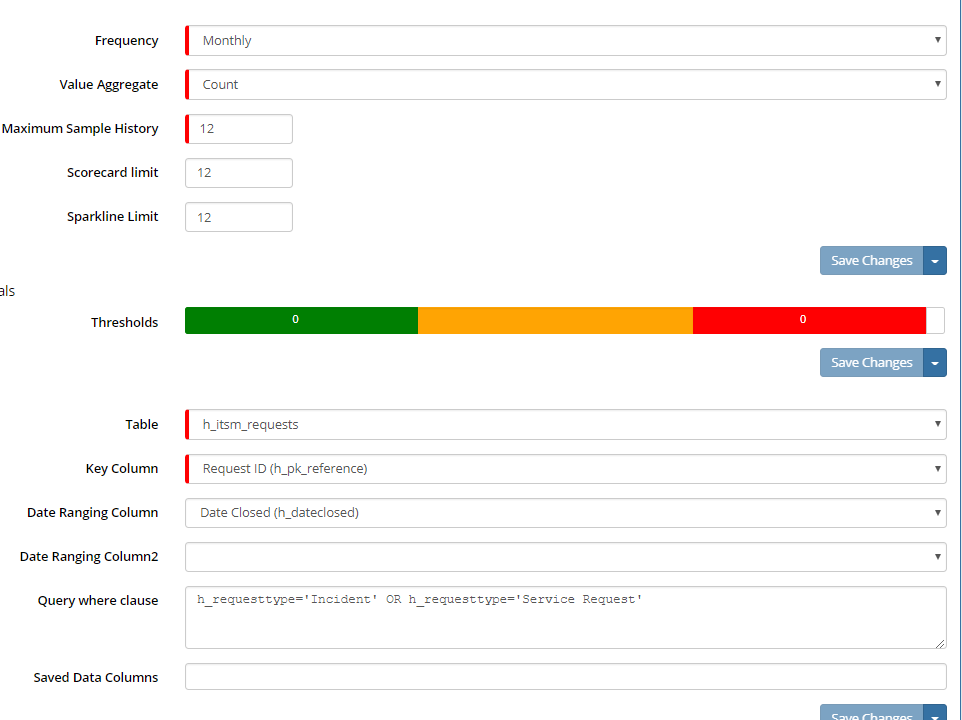
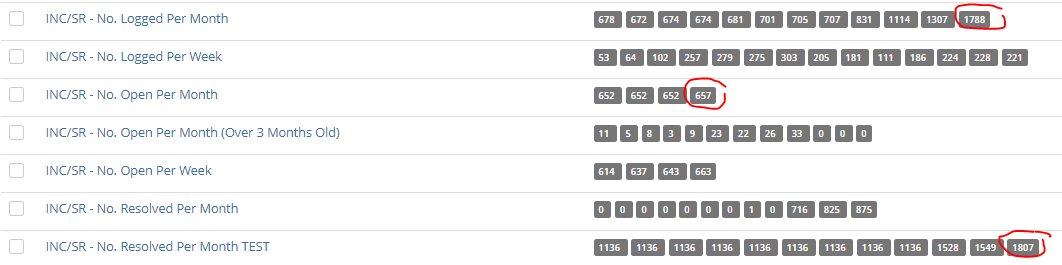
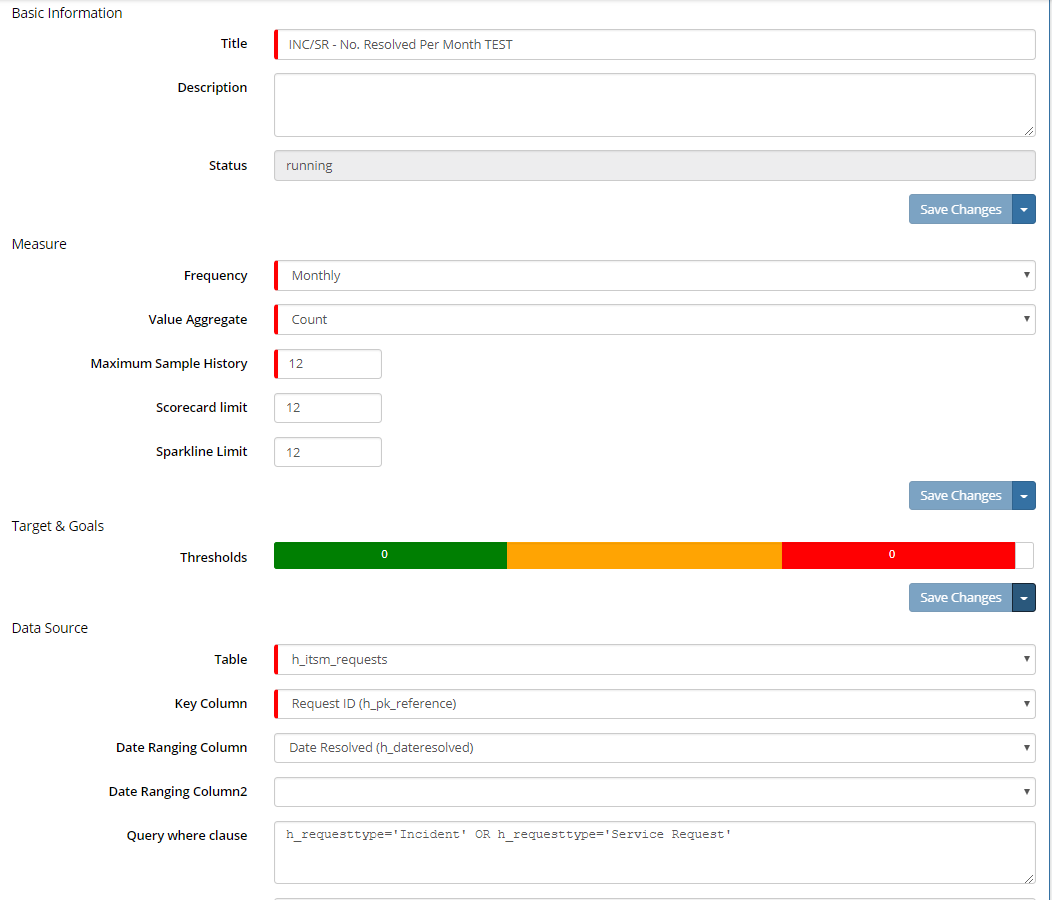
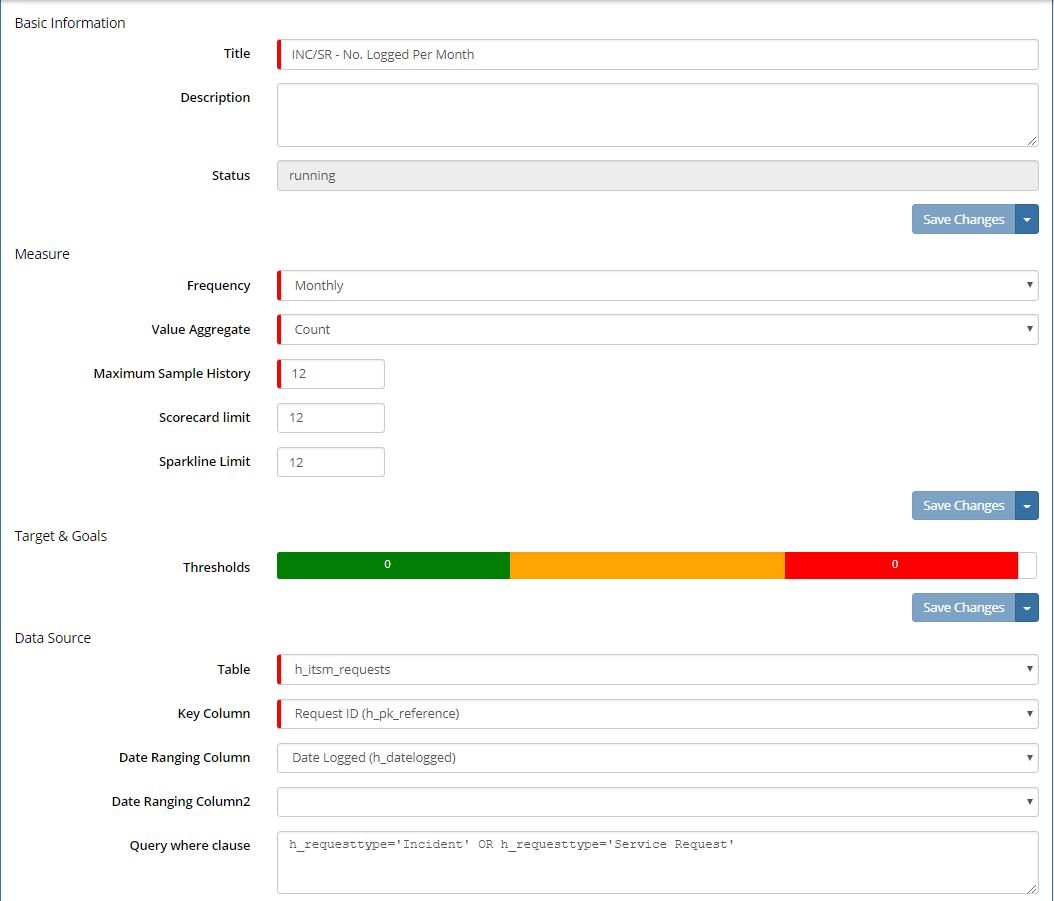
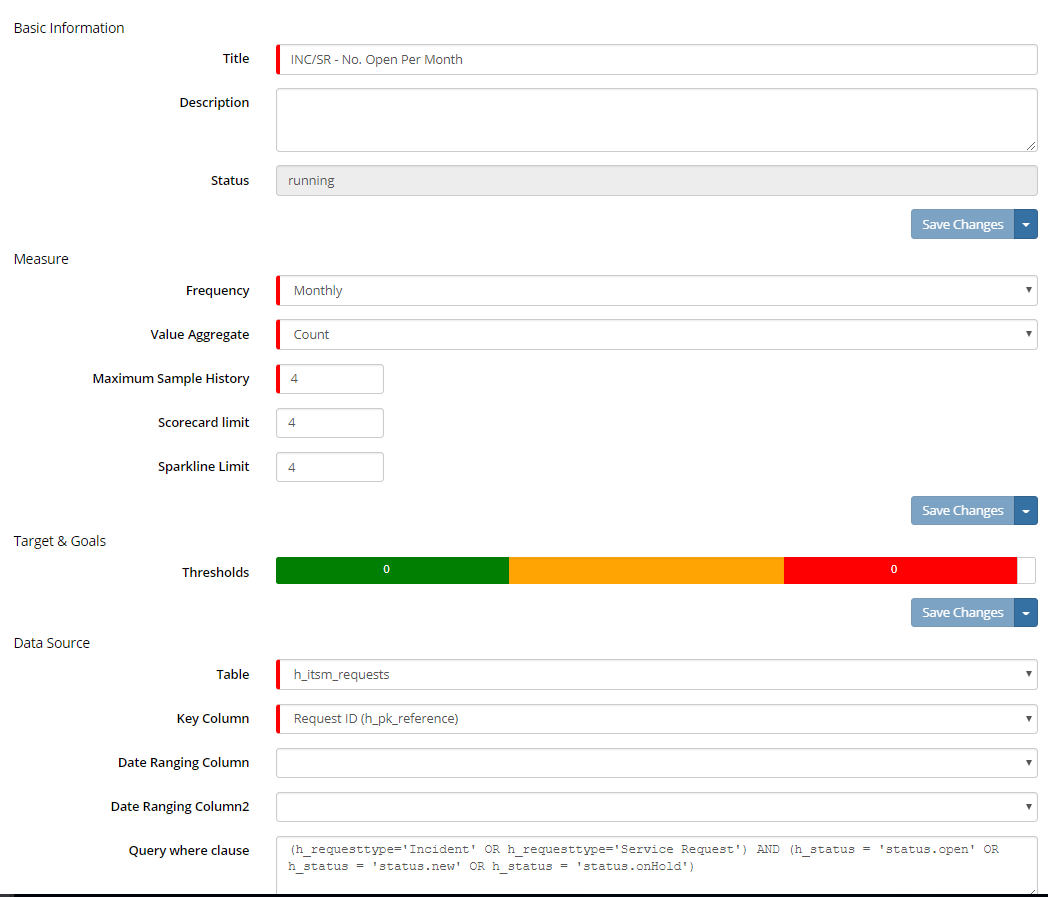
Hi all, Each month we're required to produce KPI statistics for the following monthly key service desk metrics: No. of Incidents & Service Requests Logged No. of Incidents & Service Requests Resolved No. of Open Incidents & Service Requests (Recorded as of the last day, hour, minute of the month) The problem I'm having is getting the number of open Incidents & Service Requests to correlate with the number logged and resolved. The results circled in red are those from April 2018 - unless my logic is incorrect the number of open Incidents and Service Requests for April should be: INC/SR - No. Open Per Month (End of March) = 652 + INC/SR - No. Logged Per Month (April) = 1788 - INC/SR - No. Resolved Per Month TEST (April) = 1807 TOTAL = 633 But as you can see the INC/SR - No. Open Per Month (End of April) is showing as 657. I've included some screenshots of the measures as they're currently setup. Does anyone have any suggestions or advice on how to troubleshoot this? Also, if I create a view within the request list to show all open incidents and service requests, the total open count this morning is showing 650 despite nothing being resolved between 30/04/18 11:59PM (when the measure finished) and now... So there's 7 incidents or services requests missing from the count captured in the measure. So I've got 3 separate counts for open incidents and service requests: 633 by my calculations 657 by the No. of Open Incidents & Service Requests 650 by a custom view within the request list Any help would be appreciated
-
Also, if I create a view within the request list to show all open incidents and service requests, the total open count this morning is showing 650 despite nothing being resolved between 30/04/18 11:59PM (when the measure finished) and now... So there's 7 incidents or services requests missing from the count captured in the measure. So I've got 3 separate counts for open incidents and service requests: 633 by my calculations 657 by the No. of Open Incidents & Service Requests 650 by a custom view within the request list
-
Hi all, Each month we're required to produce KPI statistics for the following monthly key service desk metrics: No. of Incidents & Service Requests Logged No. of Incidents & Service Requests Resolved No. of Open Incidents & Service Requests (Recorded as of the last day, hour, minute of the month) The problem I'm having is getting the number of open Incidents & Service Requests to correlate with the number logged and resolved. The results circled in red are those from April 2018 - unless my logic is incorrect the number of open Incidents and Service Requests for April should be: INC/SR - No. Open Per Month (End of March) = 652 + INC/SR - No. Logged Per Month (April) = 1788 - INC/SR - No. Resolved Per Month TEST (April) = 1807 TOTAL = 633 But as you can see the INC/SR - No. Open Per Month (End of April) is showing as 657. I've included some screenshots of the measures as they're currently setup. Does anyone have any suggestions or advice on how to troubleshoot this?
-
Hi Lauren, thanks for the reply. I'm using Chrome and have just tried on another device also running Chrome and have the same problem. Also tried in IE on both as a test and same thing
-
Hi all, I've just noticed that the search bar is missing from our service portal. I'm not sure how long it's been like that but I've just logged into the Hornbill demo instance and have confirmed that the search bar is appearing there. Is there a setting or something for it? As far as I'm aware nothing has changed in configuration that'd effect it. Any help would be appreciated. Thanks in advance
-
UI Improvement - Time Picker - Pause/Hold
dwalby replied to Martyn Houghton's topic in Service Manager
+1 on this. I must admit I'm also not a fan of the time/date picker within Hornbill. -
@Keith @Dan Munns Did either of you manage to create a BPM for auto-chase? I need to give it another crack myself but wanted to know whether you'd had any success.
-
Hi all, I'm trying to create a report that will allow me to perform trend analysis on the common request profiles of logged incidents and the type of logged service requests. The idea is to then proactively raise problem/known error records and FAQs for reoccurring incidents and service requests in attempt to reduce the request volumes. Initially I'd like to report on all requests that have been logged in Hornbill (we only went live in Feb so total will be approx. 3000), however I notice there's a row limit of 500. The wiki mentions this setting, however I cannot find where it is applied, please could someone advise? I've attached the report definition for reference: If possible I'd also like a summary bar chart that shows the top 10 most common request profiles. Again if possible, it'd be useful for this report to be interactive so I can drill down into the results and actually review the requests. Thanks in advance. resolved-requests-by-profile.report.txt
-
@Steven Boardman the issues stopped for us about half an hour after I originally posted, not had any further issues since.
-
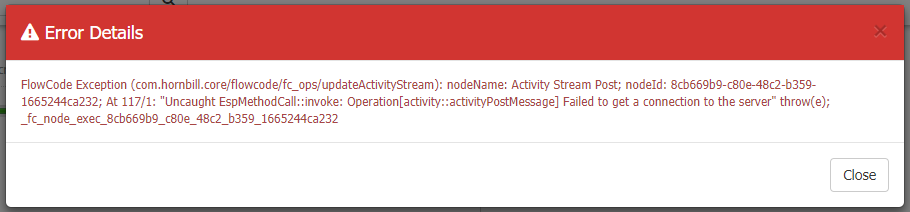
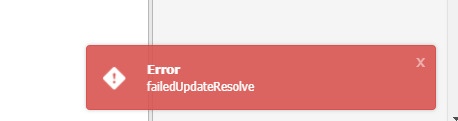
Also getting the below when attempting the update action:
-
I'm having similar issues, see below screenshot. Presumably I can retrieve more info on this from log files somewhere?
-
Hi all, Is there a setting that can be enabled to e-mail the customer when an update has been applied to a request via the update action? Currently customers will only receive an e-mail if the e-mail action has been used. Thanks in advance