

Martin.bowman
-
Posts
48 -
Joined
-
Last visited
-
Days Won
2
Content Type
Profiles
Forums
Enhancement Requests
Posts posted by Martin.bowman
-
-
@VictorHi Victor, This is still not working for our users. It is this setting that is not populating the window after clicking the email icon. It is working for myself and a few others.

-
Hi
Just to add, this used to work, in that if entering text into the email / comment window and moving away elsewhere, when returning to that point the text was still there.
Thanks
Martin-
 1
1
-
-
In addition to this, would it be possible to add the Request Preview pop up window functionality to Boards Manager so this is displayed when you hover over the Request reference, as it does on Request List for example? Thaks
-
On 2/9/2018 at 1:28 PM, Victor said:
This search option is context sensitive... it changes depending on what area you navigate to (requests, workspaces, contacts, documents, etc.)
@Victor Hi, Further to this, we would also like the option to change the default. Whilst it is context sensitive upon initial log in is more likely to want to search for a Request rather than a Co-Worker. Similarly, when viewing a workspace item I am more likely to want to then search for a Request rather than another workspace item - and so on. If we could have the option of setting an initial default, in our case we would set 'Requests', but also for it to either then 'persist' so it would remain as 'Requests' no matter where you are, or 'context' so it then changes once you move from the initial screen. Thanks
-
Hi there,
Just following up on this and wondering if there is any further news of whether an Organisational view of subscribed services is being developed at all?
Thanks
Martin
-
Hi,
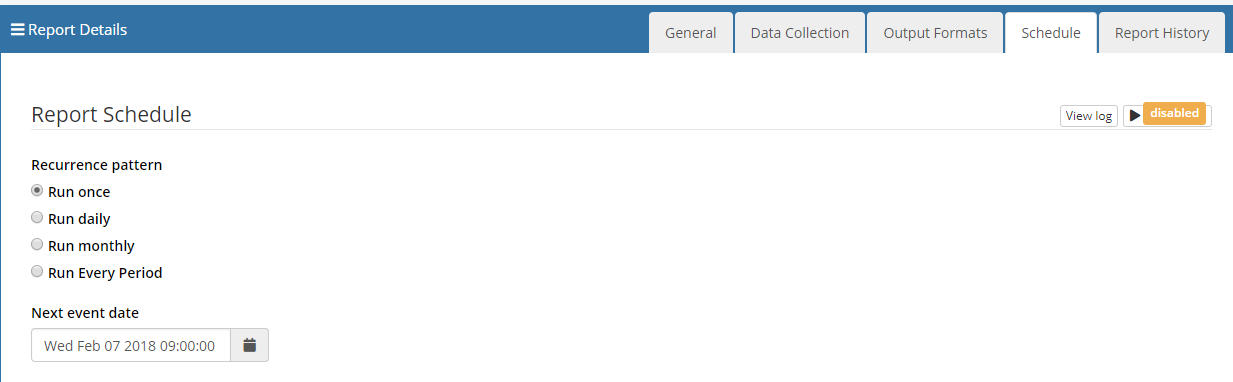
I have a report which I added Scheduling to, set to Run Once on Wed 7th Feb, although I subsequently set this to Disabled back in Feb.
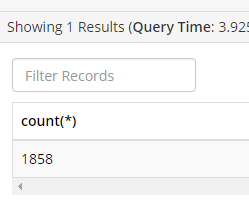
Thing is the report is actually running once a week (usually a Wednesday) every 5 minutes. I now have 63 pages of report history, and 18k+ rows.
Is there a known problem with report scheduling please?
Thanks
Martin
=======================
SELECT count(*) FROM h_sys_reports_history where h_fk_reportid = '93'
-
Further to this is there nay update please, the dates are still not being displayed in the .csv output. Thanks
Martin
-
Hi @Bob Dickinson I have tried this, does it still require users to be assigned to the Dashboard View role?
-
Hi @TrevorKillick. I realise this is still in hand but just to advise that reports now show as completed ok, but still do not contain any data in time fields. Just for info. Thanks
-
Thanks @Bob Dickinson, good idea, l'll see what can come up with. Cheers
-
Thanks @TrevorKillick
-
Hi,
Since ESP 2856 yesterday, Service Manager reports are displaying as 'Failed' status and no dates are returned in date columns withing the .csv output. The Preview works ok. Can you advise please?
Thanks
-
Thanks @Gerry @James Ainsworth for the reply. As an example of one dashboard, I have 4 Count List Widgets which are displayed as a 2x2 block (see below) . The widgets are auto refreshed regularly so give running totals. At the moment only I can see the 'live' values, unless I give access via the Dashboard Viewer role to each user. This though means they have to select through a number of options, i.e. Menu > Admin > Service Manager > Advanced Analytics > Dashboards and then select the dashboard to view, very logwinded. If there was a Dashboard menu option from within Service Manager and they are then able to select a dashboard to view from there this would be much easier. Hope this helps. Thanks. Martin
-
Hi @Gerry, Is there any further update on this at all. I have a number of Dashboards that would be useful for my team members to view at will without having to have access to the Admin menu. Thanks. Martin
-
@Mohamed I have checked the translations filtered on "ui.app.com.hornbill.servicemanager.requests.custom" and the translated labels are correct as we set them, however the labels still display incorrectly on the design form and also on the details form within a request. I have tried resetting the translated label and then re-keying and saving but this made no difference. Can you advise please.
-
Hi, Just to add, this will only work where you are a member of a supporting team for that service. If you want to see requests logged against other services which you do not support it doesn't appear to be possible to view them.
This would be something that would be very useful. For example we have a number of teams supporting different services but may wish to view ALL requests logged for a particular organisation.
In addition, when such a list is retrieved we would also wish to be able to view the request details even though we may not support that service, and without having to add ourselves as a member first of all, a view only option for example.
Your comments would be appreciated on this, unless I have missed something somewhere on how this can be accomplished.
Thanks
Martin
-
Hi,
I would just like to add my support for being able to edit posts, either on workspaces or in the timelines updates on requests. Correction of spelling and grammatical errors is one simple reason, particularly on those visible to the customer. Whilst I agree it is better to get it right first time, there will always be some missed. I also agree that versioning would be necessary to record changes, something similar to how you edit posts in Facebook for example?
Thanks
Martin
-
Thanks Gerry, that would be great.
The trouble is they are all relevant, there are just so many of them
Thanks
Martin
-
Hi,
It is possible to disable workspace notifications via membership properties, however this also disables the small orange icon indicating the number of updates to a workspace. Would it be possible please to add an additional level so that you can enable/disable just notifications whilst allowing the icon to still display?
Thanks
Martin
-
Hi,
This is also causing an issue for our users. We deal with a large number of requests and this is generating numerous and various notifications which, as Tina has mentioned, is also becoming less and less useful. A few suggestions would be:
1: Ability to order the notifications with the oldest at the top
2: Ability to group the notifications by:
i) Type - for example Customer updates, Mentions, Assigned, Workspaces etc..
ii) Date - For example 2 days ago in one group, 3 days ago in one group and so on
3: A show all option or a Show [50][100][All] etc so that one doesn't have to click Show More numerous times at the bottom on the page.
Your views/comments would be much appreciated as this issue is mentioned numerous times by users
(FYI - I work with Martyn Houghton and am looking after the system whilst he is on leave)
Thanks
Martin
-
Hi James,
Further to this do you have an update at all to when this is likely to be addressed please?
Thanks
Martin
-
Hi, Further to this, is it possible to add more than one variable?
I have RequestID but that appears to be the only one available unless I select the Flowcode Outputs from Automated Tasks.
What I am trying to achieve is
Text - RequestID - Priority
Text - RequestID works using text - &[global["inputParams"]["requestId"]]
But adding the &[global["flowcode"]["priority"]] to the end just gives an "undefined" output in this section
Could you advise where I am going wrong please?
Thankss
Martin
-
*** URGENT ***
Hi
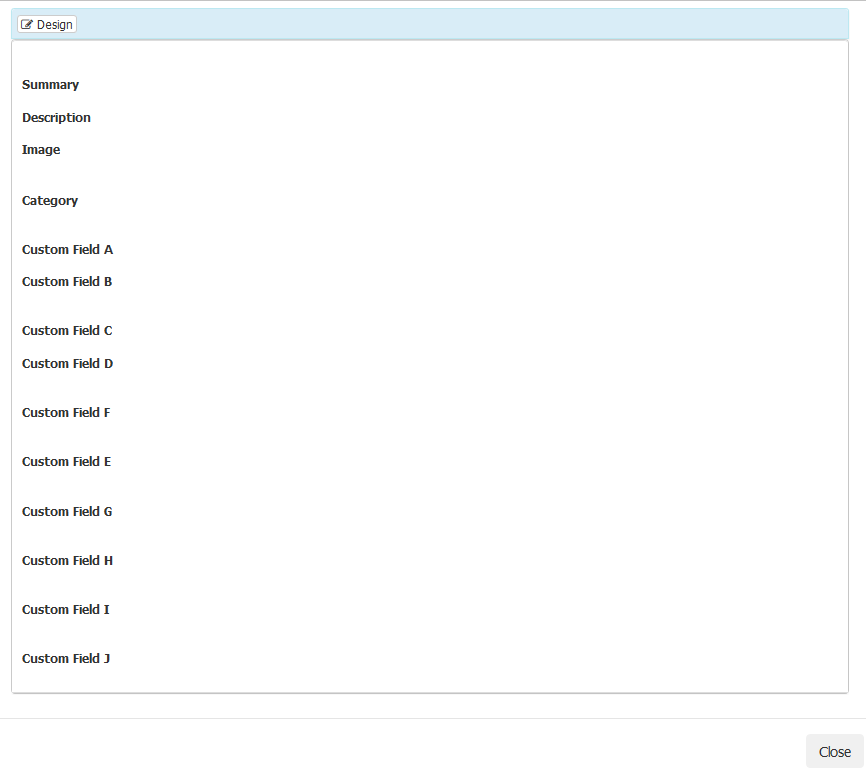
I have been working on our Services adding custom fields to the Request Configuration > Incident > View Details Form in the order below. This was all ok on Monday when we went live and on Tuesday but now appears to be corrupt. Some fields are now duplicated and out of order, so a free text field is now a drop down with the label not corresponding to the contents of the drop down. This appears to have happened after the latest update was applied to Service Manager on Tuesday evening.
Please can this be looked at and addressed as a matter or urgency as I still have a large number of services to complete, I would also rather not have to revisit those already completed.
Order of Custom fields as created
Third Party Reference Single Line text
Third Party Drop Down
Development Reference Single Line text
Development Type Drop Down
Version Drop Down
Assignee Drop Down
Assignee Status Drop Down
Condition Drop Down
Hosted Service Impact Drop Down
Customer Reference Single Line textCustom Fields now displayed (see attached document)
Thanks
Martin
-
Hi Mohamed,
I am carrying out some config work on our system with Martyn, do you have any further indication of when the update to Core Collaboration is likely to be released please?
Many thanks
Martin
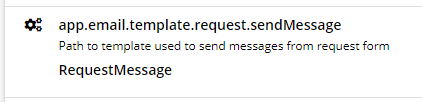


Email template not loading when using email action in requests [RESOLVED]
in Service Manager
Posted
@Victor Checked with a few users and still not working i'm afraid. They have logged out and in and cleared Browser cache