
Bob320
-
Posts
64 -
Joined
-
Last visited
Content Type
Profiles
Forums
Enhancement Requests
Posts posted by Bob320
-
-
The key part here is "those users that were providing the support service". Which those with authority are not. Budget holders who sit outside of the IT service and are typically managers of other non-analyst type users who put in a request for service that requires expenditure.
For example: as a non-IT user I request a laptop using the Service Manager "request stuff" portal. My manager must authorise the expenditure before IT can begin to service the request by purchasing or supplying a laptop. The manager has no access to Service Manager, but must be notified someone wants something from their cost centre and then authorise IT they can proceed with the expense.
-
This is a feature not available within Service Manager, for which we originally asked for and were assured it would do, but doesn't.
It was originally part of our Support Works capabilities, but like many other Support Works features we lost when we upgraded to the "new improved" Service Manager.
-
2 hours ago, Steve G said:
Hi @Bob320,
Aside from the CORS check issue, I noticed that you've mentioned you'll be making XMLMC calls using an API key for a generic user in the frontend JavaScript. This isn't very secure - anyone who has access to the web app (and therefore can see the API calls being made in the browser developer console) will be able to read the API key and use it to initiate any API calls that the generic user has rights to... I'd suggest you keep the API calls server-side, to protect the key from your web app users.
Kind regards,
Steve
Yeah I get that. But as we're only able to use the app within an environment that meets compliant device checks, or is within a "walled garden" and is within the corporate domain it's not a major concern. If our users can trawl minified js and figure that out I want them working for me

Ultimately I may stick with the server end xmlmc, just thought a client side would provide a faster UX.
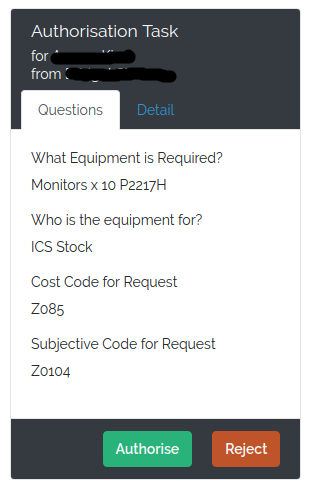
@TrevorKillick the primary role of this app is to allow non-Hornbill users the ability to authorise the procurement of equipment. So the service work flow assigns a task to our "generic" user that needs to be authorised.
My app then monitors the task list, queries the service request and does a looks up on a Hornbill list of who can authorise that task based on a cost centre that is passed as one of the questions. Then emails the non-Hornbill user to get their authorisation. Which My app then caries out by proxy. So the work flow can then continue to the next step.
Thanks for the responses though. Very useful to know so I can make a decision which way to go..
-
Does anyone have any experience on accessing the eurapi api outside of Hornbill?
We have a customer app that I wrote several years ago in PHP and Laravel. It uses an API KEY and fetches some info from Hornbill using the xmlmc and works ok. Now I'm looking at migrating my app to a fresher environment still using Laravel, but moving the front end to Vue.js.
I thought I'd just rewrite my PHP xmlmc into JavaScript and all would be well. But I didn't allow for CORS.
At present the PHP app acts as a kind of proxy where the client browser asks the server for data and the php xmlmc fetches it and hands it out to the browser. So no CORS issue here.
In the world of Vue.js I was hoping to pass off the calls for data out to the client browser. So then the servers load is lightened and the clients round trip speeds up as they get the response hot from eurapi.
I'm making a call to a "generic" user that is assigned tasks and I just want to use the task/taskGetList at this stage but in the browser ran into:
Failed to load https://eurapi.hornbill.com/xxxxxxxxx/xmlmc/task/taskGetList: Response to preflight request doesn't pass access control check: No 'Access-Control-Allow-Origin' header is present on the requested resource. Origin 'http://192.168.56.2' is therefore not allowed access.
Where the 192.168.56.2 is my virtual test server.
So is this because eurapi won't allow CORS? And am I wasting my time?
-
Many thanks @Steven Boardman
I'll have a look and make sure everything is as you said and report back!
-
Hi guys,
Just after some advice please, I'm not sure where the problem resides so please bear with me!
For some reason, when some calls are logged, they have no SLA timer (resolve by date) even though we have a priority selected.
It seems like it may be only when a particular analyst logs a call OR when the user logs it through the self service portal, but not always.
And they have the same permissions as other analysts/users.
I can't seem to find out how to fix it or where to start.
Any help would be much appreciated.
-
On 04/04/2017 at 1:17 PM, Lyonel said:
@Bob320, @DougA, I might be wrong but I think you can run dashboards and slideshows with the role "Dashboard viewer". I our current setup, we are using an AD system account with the following roles:
- Dashboard Viewer
- Report User
Then, I made sure this particular account has rights on every dashboards to be displayed on our TV monitors. And it works like a charm
Basically, you do not need a full admin account to run dashboards. Anybody with a Service Manager license and the role "Dashboard Viewer" can view dashboards and slideshows (unless I am wrong and a simple Collaboration license + "Dashboard viewer" role is enough).
As for the direct link to slideshows, you can use the autoplay feature:
https://admin.hornbill.com/crown/app/com.hornbill.servicemanager/analytics/slideshows/5/play/
Note the "/play/" at the end? This will automatically start the presentation of the slideshow
All you have to do is setup the PC displayed on the TV monitor to your slideshow in "autoplay" as the default web browser page and off you go!
Thanks for your help @Lyonel what I was actually after was a way of viewing dashboards/slideshows without having to log in to a full user account..
-
Yes it would be very useful to have access to at least view dashboard as a basic user.
I'm not keen on having to pay for extra licenses for each display we use!
-
Hi,
Wondering if it is possible to play a slideshow through an external link rather than to having to log in to the admin portal (which we have to do every day on a TV)?
If not could this feature be implemented?
Thanks
-
On 05/08/2016 at 8:14 AM, TrevorKillick said:
Hi Pete
Currently this is not possible the online status of each user is only maintained in server memory and not written to the Database so not exposable in the Dashboard at this time.
Kind Regards
Trevor KillickHi
Would this functionality be something that could be implemented?
As not everyone in our team uses the 'availability' option and always show as available even when they're not in.
Would be useful to show online, inactive and offline in a widget.
Thanks
-
 1
1
-
-
.
-
Is there a way to do this from LDAP import? there are over 600 basic users. I`m sure others have a lot more.
-
Yes we initially imported all users from LDAP, however I beleive this was a one off as it overwrites users with each import.
-
Thanks for the reply Dan, we had tried your suggestion but it only add the users of type "user" to the group. We need to add the "basic" users also.
-
Is there a quick way to add all basic users to this group?
-
Ah yes, many thanks Dan
-
When our basic users login to the service portal, they are not presented with the available services.
They only have the option to change their profile. When the "standard" licenced users login they can view all available portal services.
I`ve checked the services and in terms of subscription they are configured as "This service is available to everyone".
-
Oh yeah! Found it. Many Thanks
-
Is it possible to allow a customer to upload and attach a file when completing a progressive capture within the self service portal?
-
Is it possible to have a completion screen appear in the portal that displays something along the lines of "Thank you for raising a request" rather than the portal user being presented with the actual request ticket, which I believe some may find confusing.
-
Hi,
Can anyone tell me what the buttons do, and how to use them in the email templates? I can see that you can add button and other controls onto the email templates. Would it be possible to add a button the email recepient can click to update a related request in Service Manger?
Thanks in advance
-
Thanks Trevor,
Its working now. The advanced analytics appeared as an option in the admin portal under service manager.
I`m sure they were working ok a week or so ago.
Thanks again
-
Hi ,
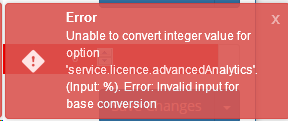
I am unable to add new or amend any existing measures, widgets or dashboards, I get the following pop up when attempting to save changes to existing or create new items: (also attached)
"Unable to convert integar value for option
service.licence.advancedAnalytics
(input %) Error invalid input for base conversion
Looks like a licence problem to me. Apparently we have a single licence for advanced analytics and no one else is using it.
-
HI all,
I am trying to create reports similar to the ones shown in the attached PDF.
(I understand I may have to have a separate report for each page)
Just to explain the first one (second page) it shows number of resolved incidents meeting/breaching SLAs for the last week.
I have selected/joined the correct tables but the issue I have is being able to create extra columns that contain manipulated data such as: counts of incident categories and splitting the categories field so i can break them down further (The current value in category is HARDWARE - PC)
I guess what I wanted to know is if there is a way to manipulate the data so I can produce these kind of reports?
Or is there an alternative to produce a report that mimics the one shown in the pdf?
Thanks!
Calling the API and hitting CORS
in Integration Connectors, API & Webhooks
Posted
Back in year zero when we had SW Hornbill came in and created the authentication process for us and all was good. When we migrated to Service Manager we knew we'd lose some functionality, but we were assured that BPM would resolve the authorisation process. But it looks like what was left unsaid was - "Yes, you can make the BPM process do that... but you'll need to purchase Analysts licenses for everyone who authorises expenditure."