

Gareth Noon
-
Posts
29 -
Joined
-
Last visited
Content Type
Profiles
Forums
Enhancement Requests
Posts posted by Gareth Noon
-
-
@Berto2002 Thanks for this. These are situations where we have asked the customer for more information etc though, and then they haven't come back to us.. So we wouldn't ask them a question and then resolve it at that point. I'm trying to catch and resolve the tickets (in an automated way) where we have asked for more information but the customer has then never come back to us.
-
We have a number of tickets that are still open (on-hold) awaiting a customer response. We are looking at the possibility of using automation to send an email from tickets that have been in the “Awaiting Customer” sub-status for x number of days (e.g. 30 days) and then set the status to resolved at that point, so that the ticket is then automatically closed after 7 days.
The email could state something like "this ticket will now be resolved due to inactivity. However, you may re-open it at any time within the next 7 days if this issue is not yet resolved. Please respond to this email to re-activate this ticket.
We have a third-party provider that uses this functionality with their Zendesk system and so wondered if there is an alternative within Hornbill Service Manager.
-
-
Same issue here, I've raised a support request for it (IN00175232)
-
Would it be possible to add a sort by (newest or oldest) to the notifications?
Feedback from some users is that when they have a lot of notifications they like to deal with the oldest first but to do this, you have to keep scrolling down.
-
We have seen quite a few instances of duplicate tickets being raised via the Customer Portal recently. I've checked the latest examples this afternoon and they were raised two seconds apart with sequential reference numbers.
This seems to be happening too often to be user error/problems with a particular connection and this is happening to numerous customers. I wondered if anybody else has been experiencing the same thing?
-
Us too. It's gone again.
-
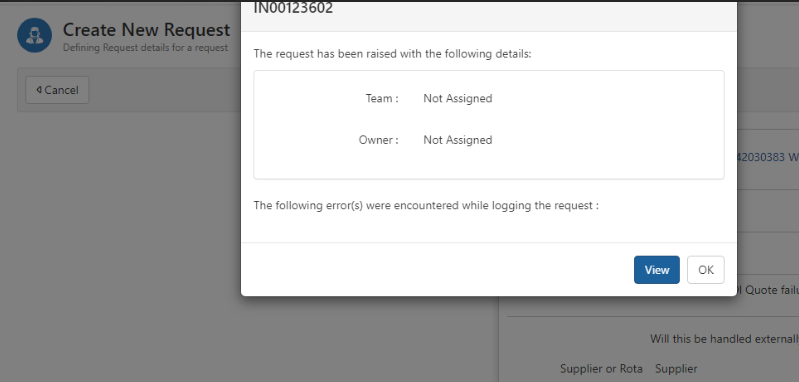
Hi, when raising a ticket from an email, the resulting message now states "The following error(s) were encountered while logging the request :"

It seems strange to display this when there aren't any errors. This seems to have been introduced in build 2526. -
Do we have an ETA for a fix on this?
Thanks,
Gareth
-
23 minutes ago, Steve Giller said:
We are aware of this issue and are looking into it.
In the meantime, as a workaround, please specify the date range, e.g:
Thanks Steve. I have a lot of charts using the 'previous month' condition in my dashboard which are used for my reporting and so I'd prefer to wait for a fix rather than modify them all and then have to change them back again.
-
It's the same for us too and I'm about to start the monthly reports.
-
 1
1
-
-
Bumping this post as we are still having to use a workaround for this.
-
 1
1
-
-
-
As an update for this, my workaround was to get the code from Wistia to embed the link and so I switched to the source option and did this which has worked.
-
Hi,
Is there a published list of Media content providers that work when adding a media link into an FAQ? I've tried adding a video tutorial into an FAQ to assist our users working from home but adding a Wistia link isn't recognised as Media when publishing the FAQ.
Thanks,
Gareth
-
+1 from me too, we've just been discussing custom field options here.
-
1
-
-
I would love to see the dashboard features expanded so they could be used to plot trends and not just the statistics from the previous month/set time period. This would save me having to export the data and using a pivot table to plot the annual trend, e.g. tickets logged by service for the last year, by month.
It would also be good to see the standard reports expanded within the Reports section too, e.g Average ratings by service.
I'm a big fan of the dashboard which helps me to provide monthly management statistics in a graphical format and if it were to include trend analysis that would be great.
Admittedly I have not done much with the Advanced Analytics tool and have a Trained for Life session booked next week to expand my knowledge in this area but from what I have seen, I agree with Lauren in that it would be good to be able to see graphs within the reporting tool, rather than having to exit and build widgets based on them.
Gareth
-
3
-
-
On 1/22/2020 at 8:29 AM, Gerry said:
All,
Please register for the Webinar on the 12th Feb where we will be introducing the new portal and the all new employee mobile experience.
https://hornbill.zoom.us/webinar/register/WN_baSpStUCRByQhRmwaFdgLA
GerryThanks @Gerry, unfortunately I'm visiting a customer that day. Will the Webinar be recorded and made available to view?
Gareth
-
1
-
-
We are eagerly awaiting this too..
-
-
Yes, this has now been fixed. Thank you.
-
Thanks @James Ainsworth
Gareth
-
Hi,
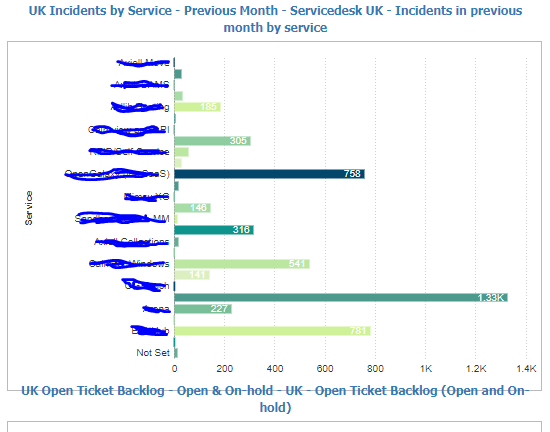
I have a new problem with my dashboard. My incidents for the previous month seems to be showing data for incidents of all time (or at least extremely high numbers):
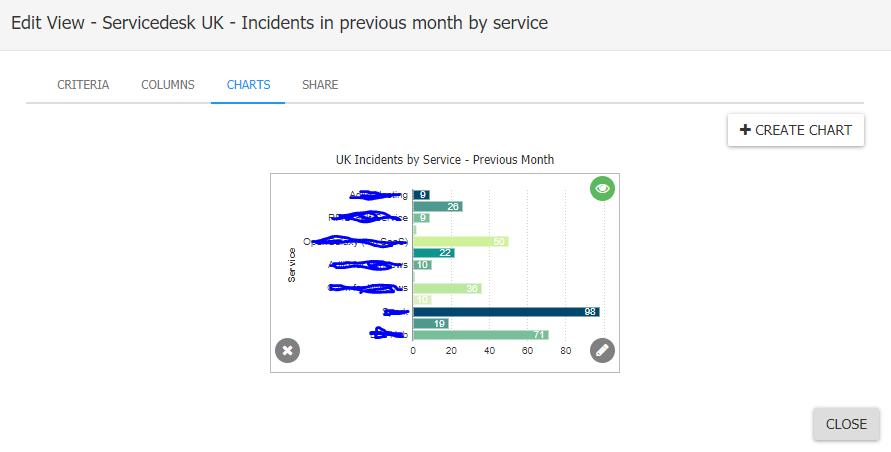
Note the service showing 1.33k which should be 98, but if I then click on the graph title to take me to the relevant view in my request list, there are only 363 requests in total (for all services). What's even stranger is if I preview the graph in the relevant view, it gives the correct data:
I'm using Chrome: Version 76.0.3809.132 (Official Build) (64-bit)
Is this a bug?
Thanks,
Gareth
PS, I've started to get the overlap of titles into the graph above again which was fixed previously (see first screenshot).
-
On 6/26/2019 at 9:36 AM, David Hall said:
Thanks for the post, we've made some changes around the layout/spacing of the charts and titles on the dashboard for the next update of Service Manager (build > 1515) which should resolve this issue.
Kind Regards,
Dave
Thanks @David Hall ,
I've just checked and it looks much better now. One point though, I can see the colours remain in the pie charts but all of the bar charts have now defaulted to blue only. Is there a reason for this?
Thanks,
Gareth


Adding a sort option to the notifications icon
in Service Manager
Posted
Has there been any movement on adding sorting options to notifications within Service Manager? Allowing users to sort oldest to newest or visa versa in their unread notificaitons?