

AndyColeman
-
Posts
96 -
Joined
-
Last visited
Content Type
Profiles
Forums
Enhancement Requests
Posts posted by AndyColeman
-
-
Good afternoon,
We have noticed that two new starters, since July are not appearing in Hornbill Service Manager. I imagine a link has broken somewhere?
Is there anywhere we can check please? We have not had this issue in the last 5 years so unsure where to go to investigate.
Thanks,
Andy
-
On 1/13/2020 at 9:35 PM, James Ainsworth said:
There was a reported issue that sounds very similar to this for which a fix has been put in place and it currently in its testing phase before going to the live environment. I can't say for sure yet if your issue is identical, but there is a possibility that this scheduled fix may also resolve this. This should be available in about a week.
Thanks James. It is causing a bit of frustration due to the fact we have suddenly lost a lot of visibility for our held tickets.
-
Hi, is there any update on this?
Thanks
-
Good morning,
Last night we updated to 1694. Now all our SLA's look a bit odd under the SLT column.
Our resolved tickets look breached (showing red in SLT column when they are not breached) when in fact they are not when going in to the 'All services' drop down menu but then when selecting 'all resolved tickets', no colours display under the SLT column.
Happy to provide screenshots of how it now looks, don't have any before and after's though I am afraid.
Thanks
-
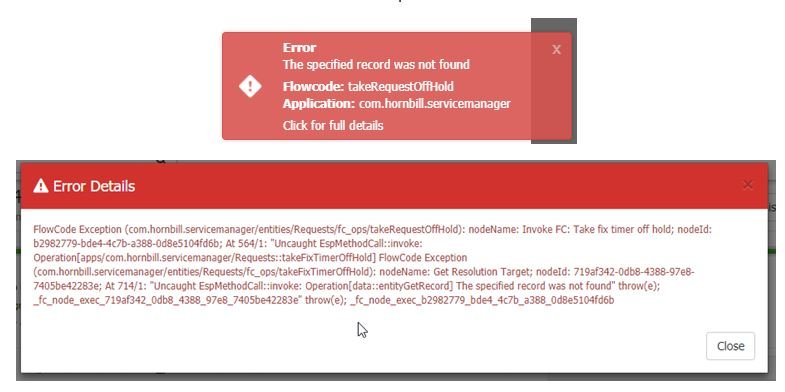
Good morning,
We updated to 1453 this morning and all my team is getting this issue when attempting to take any call off hold. It works after a refresh or two.

-
Cracking, thanks Nadeem! Appreciated.
-
Good afternoon,
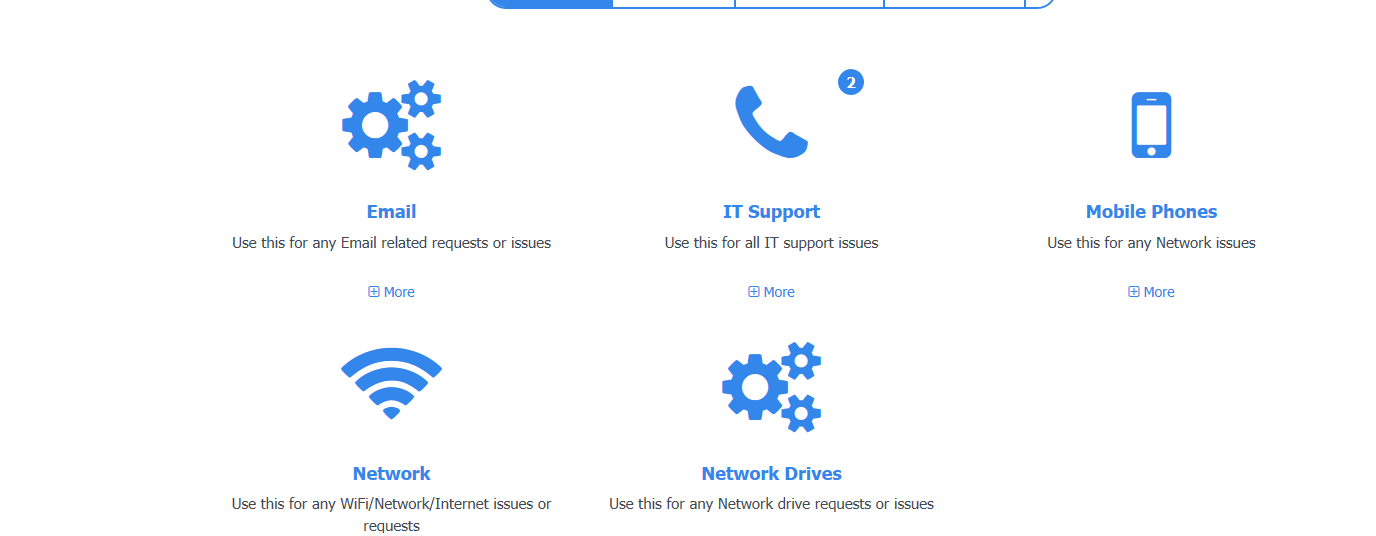
We are currently going through a change of colour scheme and I have been asked if it is possible to change the colours that appear on the writing of our services on the Self Service portal.
Please see below for the area I want to be able to change. Is it possible to change these colours to something that is not blue?
Thanks,
Andy
-
Good afternoon,
I am getting pressure for the SLA report to work as it did previously, is there anything we can do to rectify? I am supposed to get December's report in by today so I am going to have to go through and do a manual report which is obviously time consuming.
There are minimal breaches when looking at the monthly SLA dashboard which is the dashboard where I get the data for my report from but if I look back over closed tickets in December there are more breaches than my dashboard demonstrates.
Any help would be really appreciated as the report was working great last year. Our 'Total Resolved Between Date Range' still is not working correctly either but that is not as urgent. Where it previously used to show a graph with all our licenced analysts now it just displays a random 10 analysts from a selection of all teams. However it is worth noting that this is also our last months data and it does not match up with the numbers on our SLA dashboard. If you need screenshots sending over please let me know. I have sent the reports over to James previously but I believe it has now been raised with support so if someone from that team could help, that would be great.
Thanks all.
Andy
-
Happy New Year both!
This has worked fine, thank you for your help! Appreciated.
-
Good afternoon,
We have an email address createincident@ companyname.com that automatically creates an incident for us. This is great especially when we are not in the office, however the default priority is always set to Medium Incident (1 day SLA) . Do you know where in the admin tools I would need to go to change this to Low Incident? My colleague who set this up initially for us is no longer with the firm.
Thanks!
Andy
-
Hi,
Earlier this year you helped me set up an SLA dashboard showing what calls had been breached and what calls had been resolved in SLA timeframe for each month. This was then the information I would use to write my board report. The logic seems to have altered since the report from last month.
The dashboard is set to show 'last months Samples' but it conflicts the data I get if I run the 'Total resolved between date range' report. I have also checked manually for breaches within last month and some of the breaches are not being displayed on the report, I manually counted 5 breaches where the report is only showing 3 for this individual (they were all logged and resolved in November too) .
Also the count of jobs resolved for each analyst last month is coming up different to the stats shown in the widgets.
Will be doing my board report in the next week so would report assistance on this before then.
Thanks
Andy
-
-
We have also been experiencing issues since around 20 minutes ago.
-
Thanks @Gerry I will keep you posted. It certainly looks to be a problem our end. Thanks for the help.
-
 1
1
-
-
Good morning,
Since 8PM last night we have been unable to process any emails from our IT Support email address mailbox to the Hornbill mail queue.
All the emails are just storing up in the Outlook Mailbox but not processing across to the hornbill mailbox for us to create/assign tickets.
Our infrastructure team have had a look from our end and have asked if you try and connect to us as we want to see if there is an underlying network issue our end or if it is an issue your end? Any help would be greatly appreciated!
-
Update - It looks like the information is there but it is only listing 10 names and some columns are missing names next to them which is not good as I can't work out who is who.
-
Any news on this? I have come to do my next report which is vital for me to get in over the next week for SLA's met/SLA's not met. I have a Dashboard set up for this but even this has stopped picking up the correct information, it is only listing 10 people throughout the whole department when normally it gives me everyone so I can work out what percentage of SLA's we have hit and what we haven't broken down by analyst.
Any help would be appreciated.
Thanks,
Andy
-
Thanks @TrevorKillick so when will I be able to successfully run the report? I just need to set expectations from our side.
-
Hi Trevor,
I have sent you a copy of a recent one that has worked and the most recent which is what I refer to above. It's really odd that aside from what you asked me to change we have not changed anything but everything looks different.
Any help would be great.
Thanks,
Andy
-
Applying the change to 10 has now provided a graph but not how I am used to seeing it. I normally get a chart from left to right starting at which analyst had resolved the most calls over a set period of time which has always been great and a report I run regular. Now I am getting a random selection of 11 analysts and in no order that I can work out. For example from left to right the first four in the chart's numbers are as follows.
'1' '100' '236' '73'
I could really do with the report going back to normal as soon as possible please.
Thanks,
Andy
-
Thanks @TrevorKillick
I have had a look in the properties of the report and can see it has a chart title already. Do I need to change it from it's current title?
-
Thanks Trevor, I have sent via Message.
-
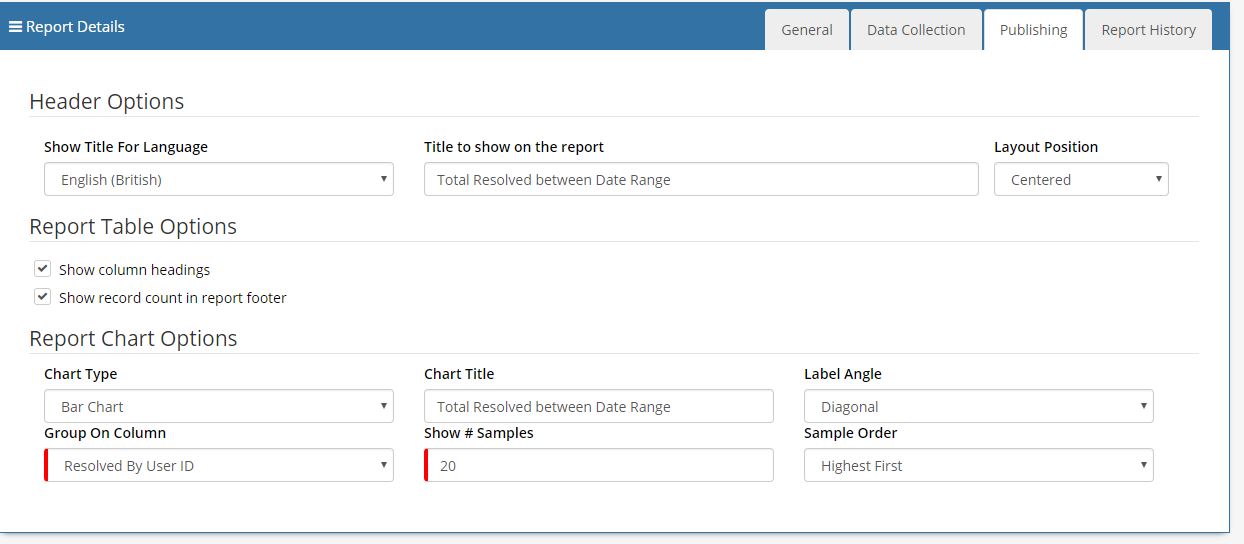
Good morning,
I run a regular monthly report on Total Resolved Jobs Between Date Range, which gives me a nice bar chart followed by the list of the requests. Today when running the report (tried twice) I am not getting my bar chart but just a list of requests.
Is there an issue? Nothing has changed from our side.
Thanks,
Andy
-
We are back up
New users not appearing
in Service Manager
Posted
Hi,
These are our current settings, looks like nothing is applied. What do we need to do to fix it? Also what are the risks of losing all our existing users?
Thanks