
Mike Jones
-
Posts
4 -
Joined
-
Last visited
Mike Jones's Achievements
")


-
Assigning Activity templates automatically
Mike Jones replied to Mike Jones's topic in Service Manager
Hi Steve, perfect thanks for the heads up - appreciate your feedback -
Hi - just wondering if anyone knows how to assign a specific activity template to a ticket that is raised for a specific category. I have new starter tickets raised and I'd like a new "starter checklist" activity template to be assigned automatically when the ticket is raised. Hopefully, someone might know how. Thanks in advance. Mike
-
SQL Query for % SLA Achieved by Team
Mike Jones replied to Mike Jones's topic in Performance Analytics
Hi @samwoo thanks so much for taking the time to reply - Been scratching my head on this one for a while. I should be able to use this as a starter - hey maybe I just don't have a chart!!!! I'll have a play with the above and let you know. Thanks again for your help really appreciate it. -
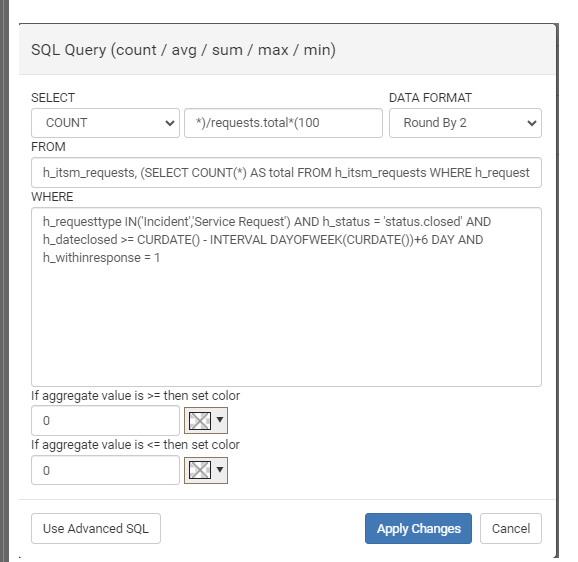
Hi there I'm new to the forum - I was hoping someone might be able to help. My SQL is not great and I'm trying to create a chart that will show me a monthly % SLA performance for Incidents and service requests grouped by each team. I have been able to create a widget that shows the weekly % SLA performance for Incidents and SR using the following query: FROM h_itsm_requests, (SELECT COUNT(*) AS total FROM h_itsm_requests WHERE h_requesttype IN('Incident','Service Request') AND h_status = 'status.closed' AND h_dateclosed >= CURDATE() - INTERVAL DAYOFWEEK(CURDATE())+6 DAY AND h_withinresponse IN(1,0)) AS requests WHERE h_requesttype IN('Incident','Service Request') AND h_status = 'status.closed' AND h_dateclosed >= CURDATE() - INTERVAL DAYOFWEEK(CURDATE())+6 DAY AND h_withinresponse = 1 Is there a way that I can add to this query to show SLA performance for Incidents & SR grouped by team. or is there a better way? Any help would be greatly appreciated. Many Thanks Mike