

David Hall
-
Posts
652 -
Joined
-
Last visited
-
Days Won
34
Content Type
Profiles
Forums
Enhancement Requests
Posts posted by David Hall
-
-
-
 1
1
-
-
What's fixed:
- PM00157462 - Customer Portal "It's still broken" button to reopen requests doesn't work correctly
-
1
-
Sorry have just seen this post. I'm just posting up now in the announcements of a new update for Service Manager so if you check on your instance shortly you should be able to apply the latest update to correct the issue.
Kind Regards,
Dave.
-
Apologies for the issue being caused. We're investigating the issue right now and we'll look to get a solution provided as soon as possible.
Kind Regards,
Dave
-
 2
2
-
-
Thanks everyone for the feedback, I can see why it could be difficult to read with certain screen contrasts etc. Will discuss with our product team to see if we can find a better way to address this.
Regards,
Dave.
-
2
-
-
In addition to the functionality @Martyn Houghton mentioned above, a recent update now gives you the option to send an email the customer when an update is added to request.
You can find details for configuring that here https://wiki.hornbill.com/index.php/Update_Action_Item#Customer_Visibility_Updates
Kind Regards,
Dave
-
1
-
-
Hi @Adambingley
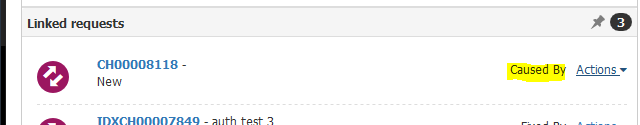
Just to pick up on your last post, the "Requests caused by change" report will show requests which have a linked Change Request with a relationship of "Caused by". So for example if you link a change to an incident and choose the relationship "Caused By" then it should be shown in the report.
Hope that makes sense,
Regards,
Dave

-
1
-
-
Thanks for the post. I can confirm that this has been addressed ready for the next update of Service Manager so that you will be able to control whether to continue to reset or maintain the sub-status when closing down the request.
Kind Regards,
Dave.
-
The settings should be automatically saved as you toggle each one so there is no need for a save button here. If you make a change and refresh is the change reflected?
Regards,
Dave.
-
Thanks for the post, no issue just an update to our chart library which defaults to a single colour. As explained here we will be re-introducing alternating colours in the next update of Service Manager.
Kind Regards,
Dave.
-
Thanks for the suggestions @davidrb84
@James Ainsworth Some considerations for future enhancements of reporting options.
-
Hi @davidrb84
The post was really just to clarify that the underlying chart library changes were the reason for the display changes to single series data... there is no specific plan to introduce multi series charts right now but please feel free to post up examples of the type of charts/reports you are looking for and the requirements can be reviewed by our product team for possible future inclusion.
Kind Regards,
Dave
-
Hi Hayley,
The latest Service Manager update is now using an updated version of our charting library which now shows each data series in a single colour, hence the single blue colour in the bar charts but multiple colours in pie charts etc. We're in the middle of rolling our charting updates and colour/theme changes so we can look to see if its possible to reintroduce a range of colours for a single series of data as we move forward.
Kind Regards,
Dave.
-
5
-
-
Hi @TomW
All date times are stored in UTC time in the database which will be the same as GMT. We then adjust times on the front end based on the user's timezone preferences, hence you see the display time being an hour ahead as this will be in BST (GMT+1).
Hope that makes sense?
Kind Regards,
Dave
-
Hi @Gareth Noon
Glad that this has improved the layout for you. With regards to the colours, we've applied a new chart theme following an update to our charting tool which is now using a blue/green toned colour wheel so as you update charts you'll have the new set of colours. More than happy to accept feedback as the chart display improvements are still in progress.
Kind Regards,
Dave.
-
1
-
-
Thanks for the post. I can replicate the same problem here with the icons that are part of the new icon set. We'll raise a problem for it and get it addressed.
Kind Regards,
Dave.
-
Thanks for the post, we've made some changes around the layout/spacing of the charts and titles on the dashboard for the next update of Service Manager (build > 1515) which should resolve this issue.
Kind Regards,
Dave
-
Thanks for the post. I've just been testing this out, I've set my home page image to a web URL which displays correctly and if I publish a bulletin I don't seem to see any blank views, I just see the home page image as expected.
Not sure if I'm missing something in the replication steps or perhaps you could advise which browser you see this on to check if its a browser issue, I tested in Chrome initially and looks fine.
Kind Regards,
Dave.
-
Looks like you are using the priority based service levels in which case we need to base the query from the requests table instead.
The following query should give you all of the open requests that have either missed the response time or will hit the response time within the next 2 hours.
SELECT h_pk_reference, TIMESTAMPDIFF(SECOND, NOW(), h_respondby) AS RemainingTime
FROM h_itsm_requests
WHERE (h_status='status.open' OR h_status='status.new')
AND h_respondby IS NOT NULL
AND h_responsetime IS NULL
AND ((TIMESTAMPDIFF(SECOND, NOW(), h_respondby) < 0) OR ((TIMESTAMPDIFF(SECOND, NOW(), h_respondby) >= 0) AND (TIMESTAMPDIFF(SECOND, NOW(), h_respondby) < 7200)))
Perhaps you can try this one out?
Regards,
Dave
-
Are you using the service based service levels? e.g. do you have any data in the h_itsm_request_slm_targets table? If not then we would need to revert back to the request table to get this data.
Also I'm not sure I understand what you mean by merging the numbers? Do you mean put the two counters into the one widget?
Regards,
Dave.
-
So I've just had another look, seems I made a typo above, but in any case the widget queries needed a bit more refining.
For the response due in 2 hours try this query which should return all running response targets due within the next 7200 seconds (2 hours):
select count(*) from h_itsm_request_slm_targets
where h_name='Response'
and h_target_met is null
and h_state = 0
and (TIMESTAMPDIFF(SECOND, NOW(), h_target_time) > 0 and TIMESTAMPDIFF(SECOND, NOW(), h_target_time) < 7200)and for the second counter you could try this which returns running response targets where the target time is in the past
select count(*) from h_itsm_request_slm_targets
where h_name='Response'
and h_target_met is null
and h_state = 0
and TIMESTAMPDIFF(SECOND, NOW(), h_target_time) < 0Do these give you what you need?
-
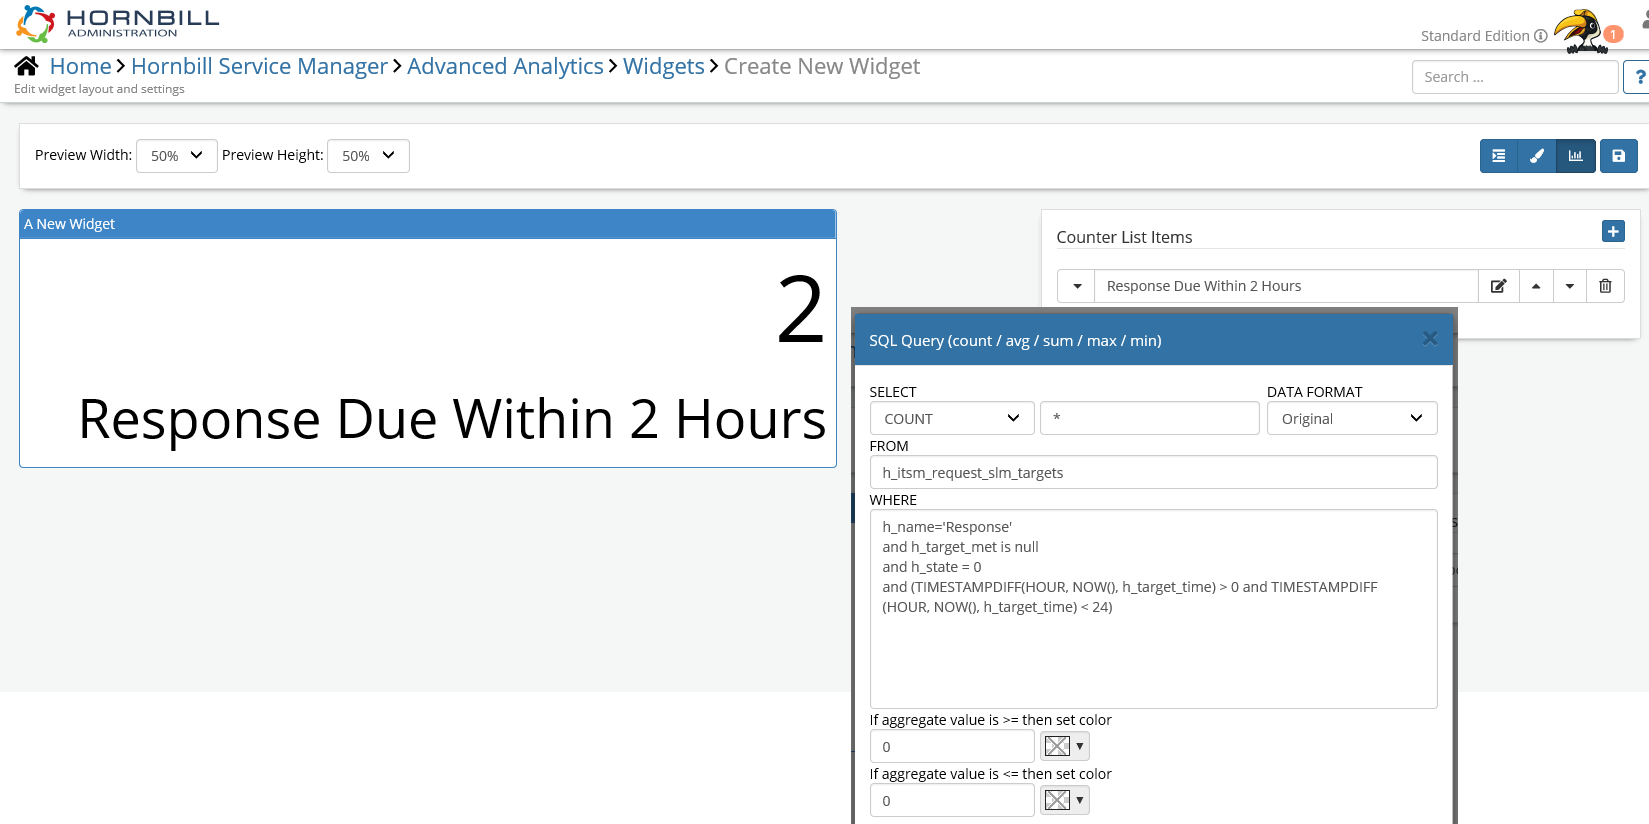
Perhaps you could give this widget set up a try? Based on the query:
select count(*) from h_itsm_request_slm_targets
where h_name='Response'
and h_target_met is null
and h_state = 0
and (TIMESTAMPDIFF(HOUR, NOW(), h_target_time) > 0 and TIMESTAMPDIFF(HOUR, NOW(), h_target_time) < 24)
Kind Regards,
Dave
-
Thanks for posting this up. The issue has been confirmed and there will be a fix for this in an upcoming collaboration update.
Kind Regards,
Dave.
-
Hi @HHH
Yes you can configure that using routing rule templates, the information you need should all be here
https://wiki.hornbill.com/index.php/Routing_Rule_Templates
Kind Regards,Dave.
-
1
-
Placing request on hold within BPM
in Service Manager
Posted
@Adrian Simpkins
Another thought, with the on hold period values... might be worth putting 0 into the other columns for years/months/days etc.