
KShep
-
Posts
13 -
Joined
-
Last visited
KShep's Achievements
")


-
Embarrassingly, I'm falling at the first hurdle. I can't locate "Admin"?
-
Could you possibly link me to the "library board" for this post please?
-
Do we believe it's likely this enhancement request will be picked up please?
-
Hi James, Thanks for the suggested but unfortunately we already utilise this. We often have a lot of updates between "check points" where we manually update the timeline and it's these updates we'd wish for the Connections to see. It seems strange that they can't when they do receive all the "check point" emails.
-
Understood. Thanks all.
-
Hi. Yes, email.
-
The original Customer will but added Connections currently don't...
-
Currently we can’t which means there’s a lot of tidying up to do in Excel after the data’s exported, rendering it not useable for many of my team.
-
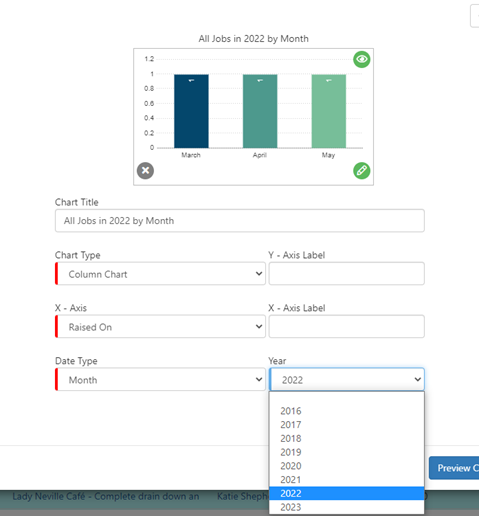
Was that created within Service Manager and creating a graph from a View?
-
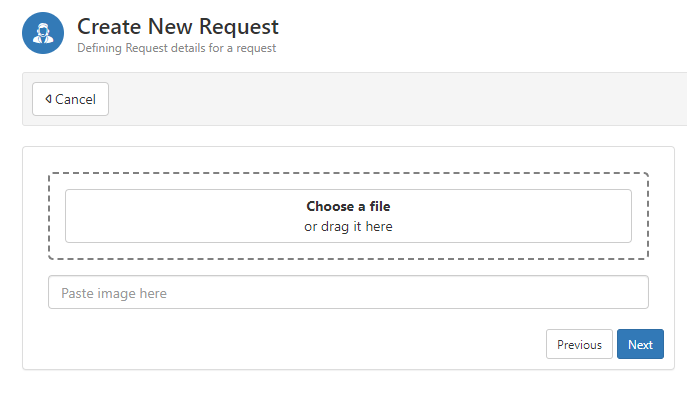
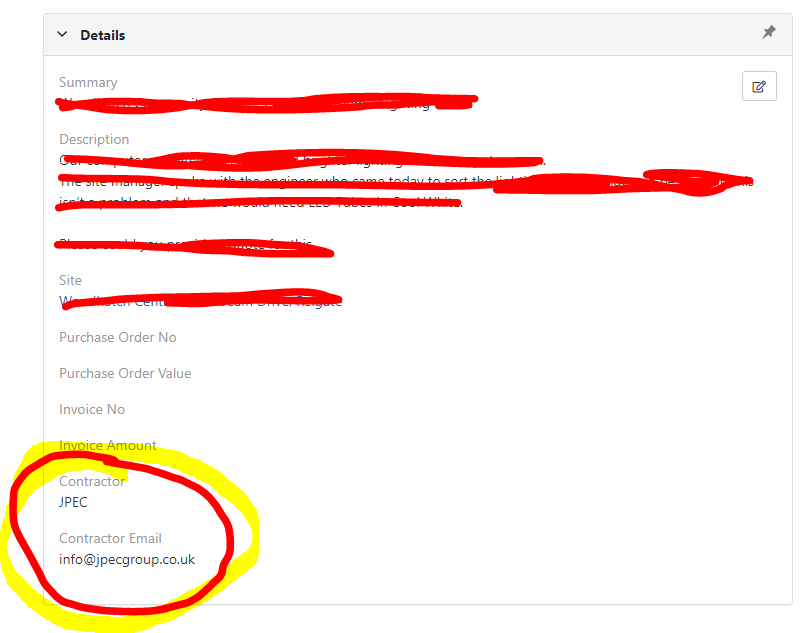
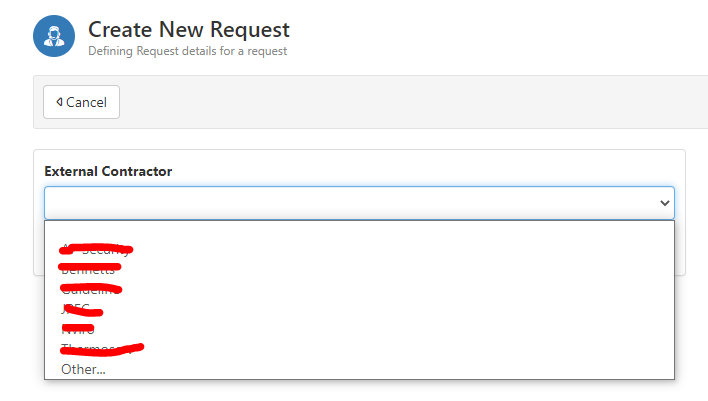
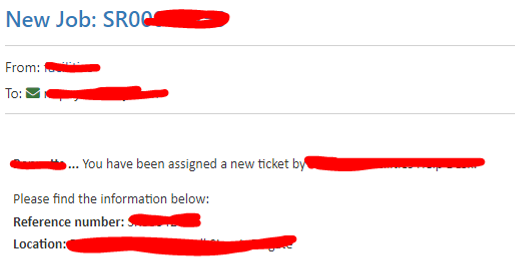
Hi Steve. When we record new tickets we have the option to upload files/images: We also select an "External Contractor" who the ticket needs to go to: After the ticket is logged the contractor will then receive a notification email: But on this email any of the files/images attached to the ticket aren't sent. When speaking with a developer they advised this isn't currently possible and would need to be logged as a Feature Request... Hope this helped clarify?

-
Clarification: The enhancement is a request to be able to add Request Attachments to an Email sent by the business Process.
-
For example, to have a bar graph showing how many jobs were created by “Self-service” and “Analyst” per month. Currently you can only do either “Self-service” per month, or “Analyst” per month, on separate graphs but not together on one.
-
Currently you can only select a specific year, not a rolling time period. This means at the start of each year (Jan/Feb/March) I can’t see data from last year (2022) as well as the current months (in 2023).